Bitcoin (BTC) Weekly RSI Shows Signals That Historically Preceded Bottoms

Bitcoin (BTC) Weekly RSI Shows Signals That Historically Preceded Bottoms
фото показано с : beincrypto.com

2022-7-18 11:15

Bitcoin (BTC) is in the process of breaking out from an important resistance area, a movement that is supported by both the weekly and daily RSI.

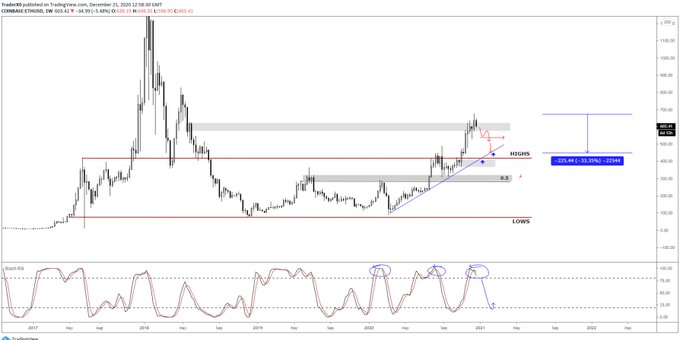
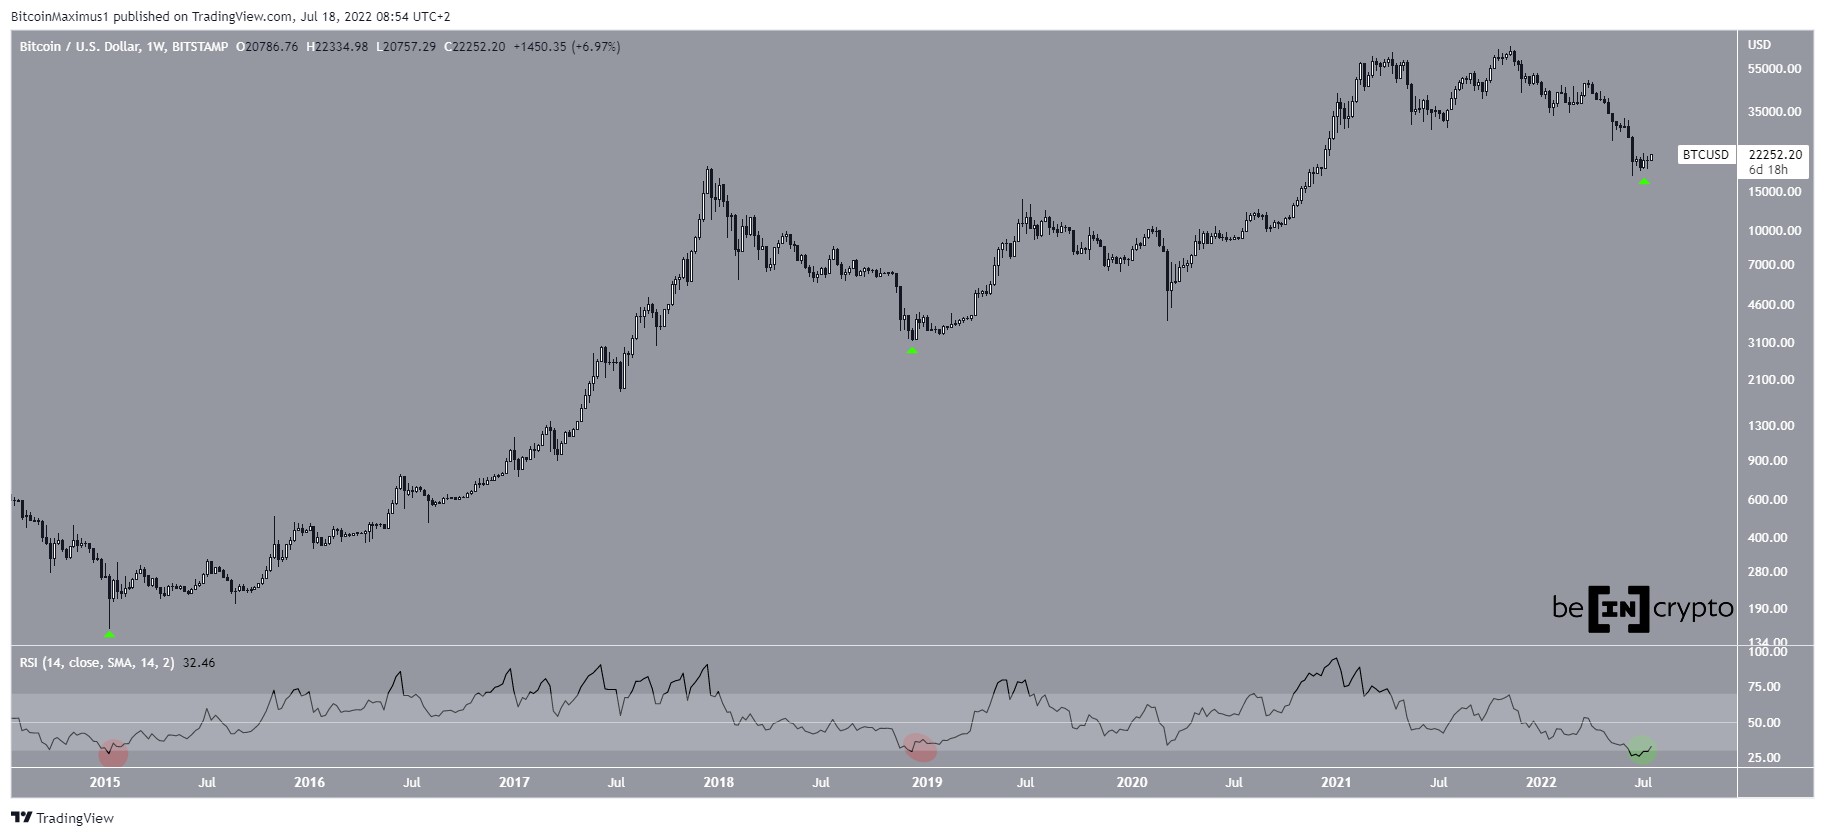
Bitcoin has been decreasing since reaching an all-time high price of $69,000 in November 2021. The downward move has so far led to a long-term low of $17,592 in June 2022. The price has been overall increasing since then. 

At the time of the low, the weekly RSI fell to the oversold territory (green circle). This was only the third time (green icons) this has occurred throughout the entire price history of BTC. Due to last week’s increase, the RSI has now moved outside of its oversold territory. 

Historically, similar RSI movements have been a sign that the price bottom was in.

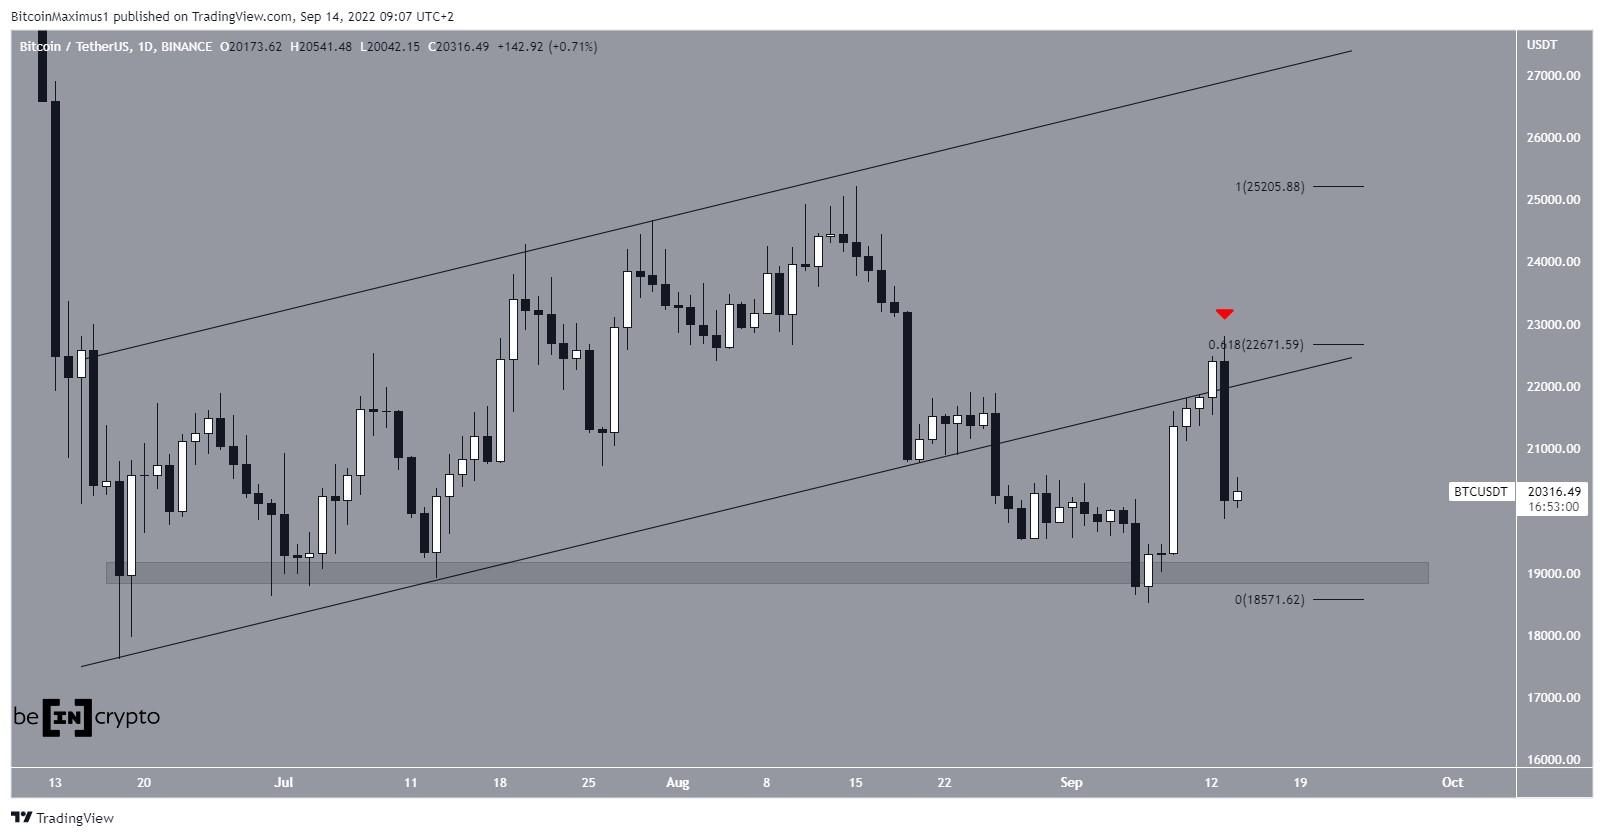
BTC/USD Chart By TradingView Current resistance

The daily chart shows that BTC had been trading under a descending resistance line since the beginning of April. This line caused a rejection on June 5, leading to the aforementioned low. 

Currently, the price is in the process of breaking out above the resistance line, which currently also coincides with the $21,700 horizontal resistance area. If it’s successful in doing so, the next closest resistance would be found at $29,370, created by the 0.382 Fib retracement resistance level.

The daily RSI has already broken out from its resistance line, suggesting that the price could soon do the same. Additionally, it’s currently in the process of moving above 50.

BTC/USDT Chart By TradingView BTC wave count analysis

The most likely wave count suggests that the price has already completed a five-wave downward move (yellow) when measuring from the beginning of April. Due to the extreme length of wave four, it seems that the fifth and final wave was truncated, hence its failure to move below the bottom of the third wave. 

BTC/USD Chart By TradingView

As for the longer-term wave count, it seems likely that the price has completed an A-B-C corrective structure (red) when measuring from the all-time high. This fits with the weekly RSI readings which indicate that a bottom has been reached.

BTC/USD Chart By TradingView

For Be[in]Crypto’s previous bitcoin (BTC) analysis, click here.

The post Bitcoin (BTC) Weekly RSI Shows Signals That Historically Preceded Bottoms appeared first on BeInCrypto.

Similar to Notcoin - TapSwap on Solana Airdrops In 2024

origin »

ETH/BTC RSI Ratio Trading Set (ETHBTCRSI) на Currencies.ru

$ 301.77 (+0.73%)
Объем 24H $0
Изменеия 24h: 7.40 %, 7d: 16.64 %
Cегодня L: $301.77 - H: $301.77
Капитализация $0 Rank 3757
Доступно / Всего 0 ETHBTCRSI

rsi bitcoin weekly bottoms preceded btc signals

rsi bitcoin → Результатов: 126


Don’t Sell Your Bitcoin and Ethereum on RSI Warnings: Analyst

A recent volatile run-up in the Ethereum and Bitcoin markets has exceeded their value into “overbought” regions, as per Relative Strength Indicator (RSI). In retrospect, the RSI is a momentum indicator that measures the magnitude of recent price changes in an asset to determine its overbought or oversold conditions. Displayed as an oscillator, it can […]

2021-1-9 16:26


Фото:

Bitcoin Funding Rates Flip Negative as Sellers Build Momentum; What to Watch For

Bitcoin has seen some intense turbulence throughout the past day, with the cryptocurrency losing the support it had at $9,400 before plummeting into the $8,000 region Buyers were able to guard against the massive influx of selling pressure, supporting it above $9,000 for most of the day The defense of the upper-$8,000 region has caused the crypto to form a double bottom seen while looking towards its RSI This indicates that the crypto could be […]

2020-6-16 02:00


Курс криптовалют на 04.03.2020 (Tezos приятно удивил)

Восстановление цен на криптовалюты с минимума прошлой недели, неуклонно растет, чтобы протестировать 9000 долларов. Bitcoin Согласно Индексу относительной силы (RSI), BTC снова в руках быков. Более того, способность защищать поддержку на уровне $ 8 800 означает, что биток вернулся в бычью фазу.

2020-3-5 16:58


Bitcoin Price RSI Breakout Could Target $9K Short-Term

Bitcoin price has been trapped within a powerful downtrend that’s cut the leading cryptocurrency by market cap’s value by nearly 50% over the course of the last few months. Coinciding with the downtrend, Bitcoin’s Relative Strength Index has been confined below a decreasing trendline that the cryptocurrency has now broken out of, suggesting that a... The post appeared first on NewsBTC.

2020-1-6 19:00


Прогноз: Биткоину грозит откат ниже $9000

Забег биткоина, который мы наблюдали в минувшие, выходные скоро сменится небольшим откатом монеты. Так считают некоторые трейдеры, зафиксировавшие сигналы к ослаблению курса BTC. В ближайшее время биткоин подешевеет ниже $9000 в рамках коррекции, так как агрессивный запал инвесторов угасает, и на смену экспансии придет фаза длительной обороны.

2019-10-28 11:13


Крипторейдеры ожидают откат биткоина ниже $9000

Забег биткоина, который мы наблюдали в минувшие выходные скоро сменится небольшим откатом монеты. Так считают некоторые трейдеры, зафиксировавшие сигналы к ослаблению курса BTC. В ближайшее время биткоин подешевеет ниже $9000 в рамках коррекции, так как агрессивный запал инвесторов угасает, и на смену экспансии придет фаза длительной обороны.

2019-10-28 11:09


Фото:

Анализ цен криптовалют: впереди жесткое сопротивление

О дальнейших возможных сценариях движения цены биткоина и нескольких популярных альткоинов рассказывает ведущий аналитик RoboForex Дмитрий Гурковский. Покупатели пытаются спровоцировать рост крипторынка, однако, скорее всего, это лишь очередная коррекция перед продолжением движения вниз.

2019-10-11 19:15


Анализ цен BTC, ETH, XRP (01.08.19)

BTC/USD Вчера восстановление цены BTC продолжилось, и на этот раз оно было поддержано объёмами немного больше среднего уровня. Ещё до завершения дня пара смогла достичь психологическую отметку 10000.

2019-8-1 09:03