2021-10-28 09:32 |
Bitcoin (BTC) resumed its descent on Oct 27 but is most likely approaching the end of its short-term corrective movement.
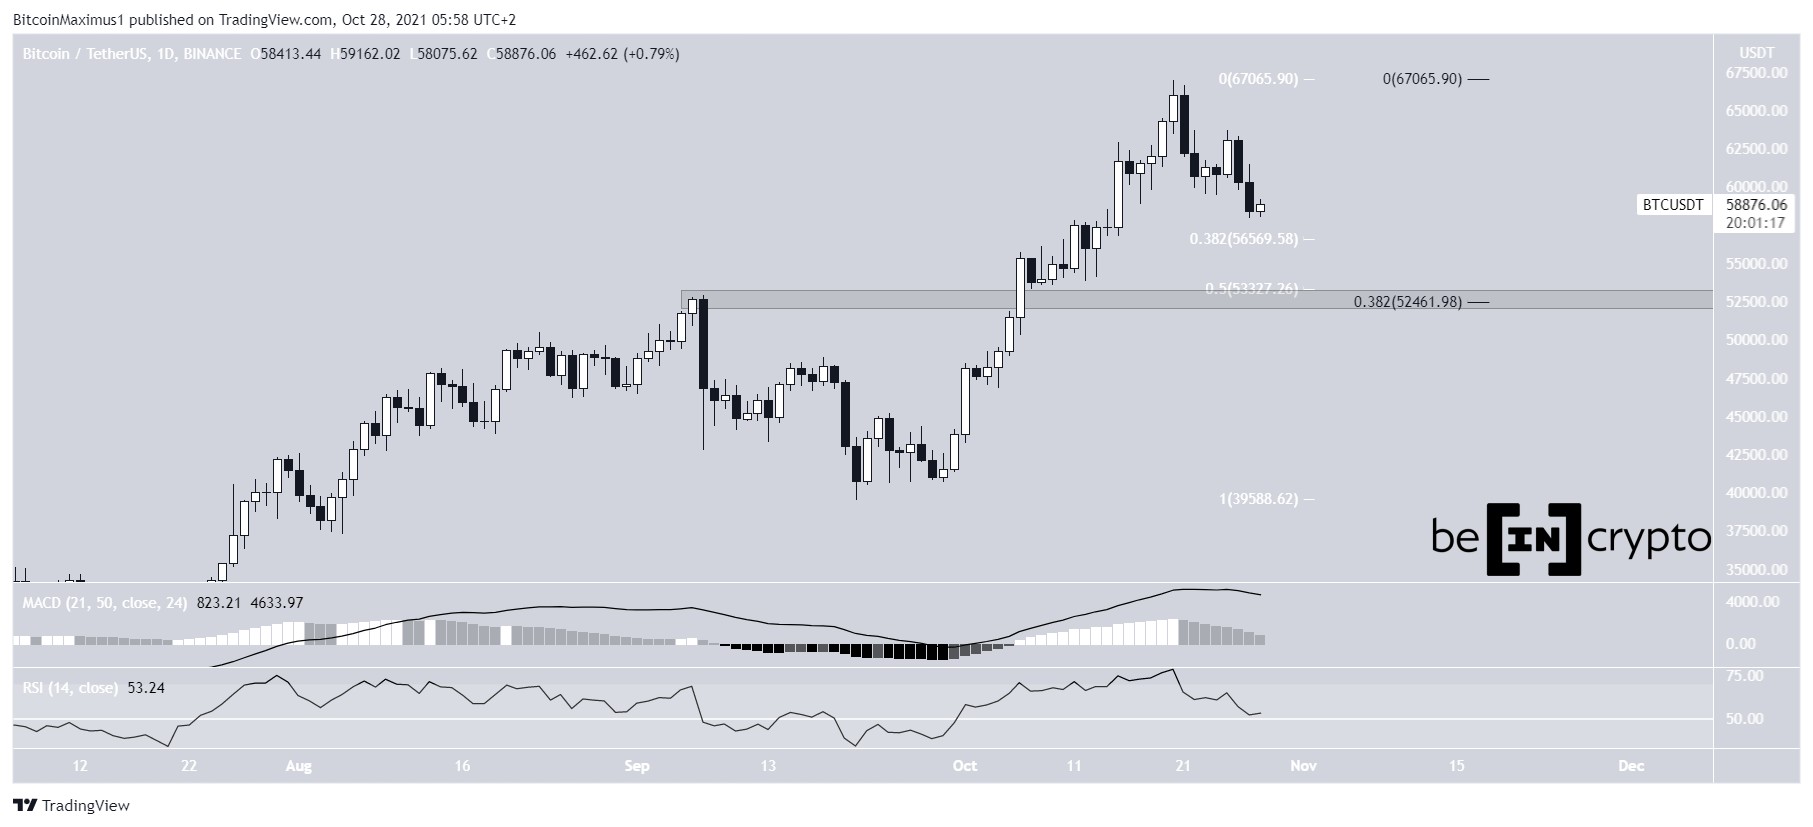
BTC has been moving downwards since reaching an all-time high price of $67,000 on Oct 20. The decrease accelerated on Oct 26, and BTC reached a low of $58,000 the next day.
There is minor support at $56,550, created by the 0.382 Fib retracement support level. However, the main support area is found at $52,450-$53,350. This is the short-term 0.5 Fib retracement level (white), the long-term 0.382 Fib retracement level (black), and a horizontal resistance area. Therefore, if BTC falls back to this zone, the area is expected to provide strong support.
Technical indicators in the daily time frame are bearish, supporting the continuation of the downward movement.
The MACD is decreasing and has nearly crossed below 0. The MACD is created by using a short and long-term moving average (MA). Despite the indicator still being positive, the downward slope shows that the short-term MA is losing speed.
The RSI, which is a momentum indicator, is falling towards the 50-line. Crosses above and below 50 are commonly used to determine the direction of the trend. Similar to the MACD, the fact that the RSI is above 50 is a bullish sign, but its downward slope shows that momentum is diminishing.
BTC Chart By TradingView BTC wave countThe short-term wave count shows an A-B-C correction, in which BTC is in the C wave.
This is the final portion of the decrease, after which BTC is likely to resume its previous upward move.
Furthermore, it’s possible that the movement is contained in a descending parallel channel. This further supports the possibility that BTC will drop towards $56,550 since the area coincides with the support line of the channel. Also, it would give waves A:C a 1:1 ratio, which is common in such corrections.
If the channel breaks, then BTC would be likely to decrease towards the previously outlined $52,450-$53,350 support area before continuing upwards.
BTC Chart By TradingViewIn the long-term, BTC seems to be in a massive 1-2/1-2 wave formation. This means that after the current short-term correction is complete, the increase would be expected to accelerate greatly.
BTC Chart By TradingViewFor BeInCrypto’s previous Bitcoin (BTC) analysis, click here.
The post Bitcoin (BTC) Struggles to Gain Footing After Falling Below $60,000 appeared first on BeInCrypto.
origin »Bitcoin price in Telegram @btc_price_every_hour
Bitcoin (BTC) на Currencies.ru
|
|


