2022-8-18 11:15 |
Bitcoin (BTC) has been falling since Aug. 15 and is showing signs that the upward trend that it’s been enjoying since June 18 has come to an end.
Bitcoin has been mostly moving upwards since June 18. On July 18, it broke out above a descending resistance line that had been in place since the end of March.
Despite the breakout, it did not sustain its upward movement and only managed to reach a local high of $25,211 on Aug. 15. The high was considerably below the 0.382 Fib retracement resistance level at $29,370.
Bitcoin has been falling since then, creating a long upper wick (red icon) on Aug. 15. So far, it has reached a low of $23,180 on Aug. 17.
The daily RSI has now broken down from its ascending support line (green), which had been in place since the upward move began. Such decreases are often a sign that the preceding upward move has come to an end.
If the downward trend continues, the closest support area would be found near $21,550.
BTC/USDT Chart By TradingView Short-term patternThe six-hour chart shows that BTC has been trading inside an ascending parallel channel since making its June 18 low. Such channels usually contain corrective patterns, meaning that an eventual breakdown from the channel would be expected.
Moreover, Bitcoin has generated a bearish divergence at the resistance line of this channel (green line). It then broke down from an ascending support line (dashed) that had been in place since July 12.
So, the six-hour chart is in alignment with the daily time frame, suggesting that a downward move is expected.
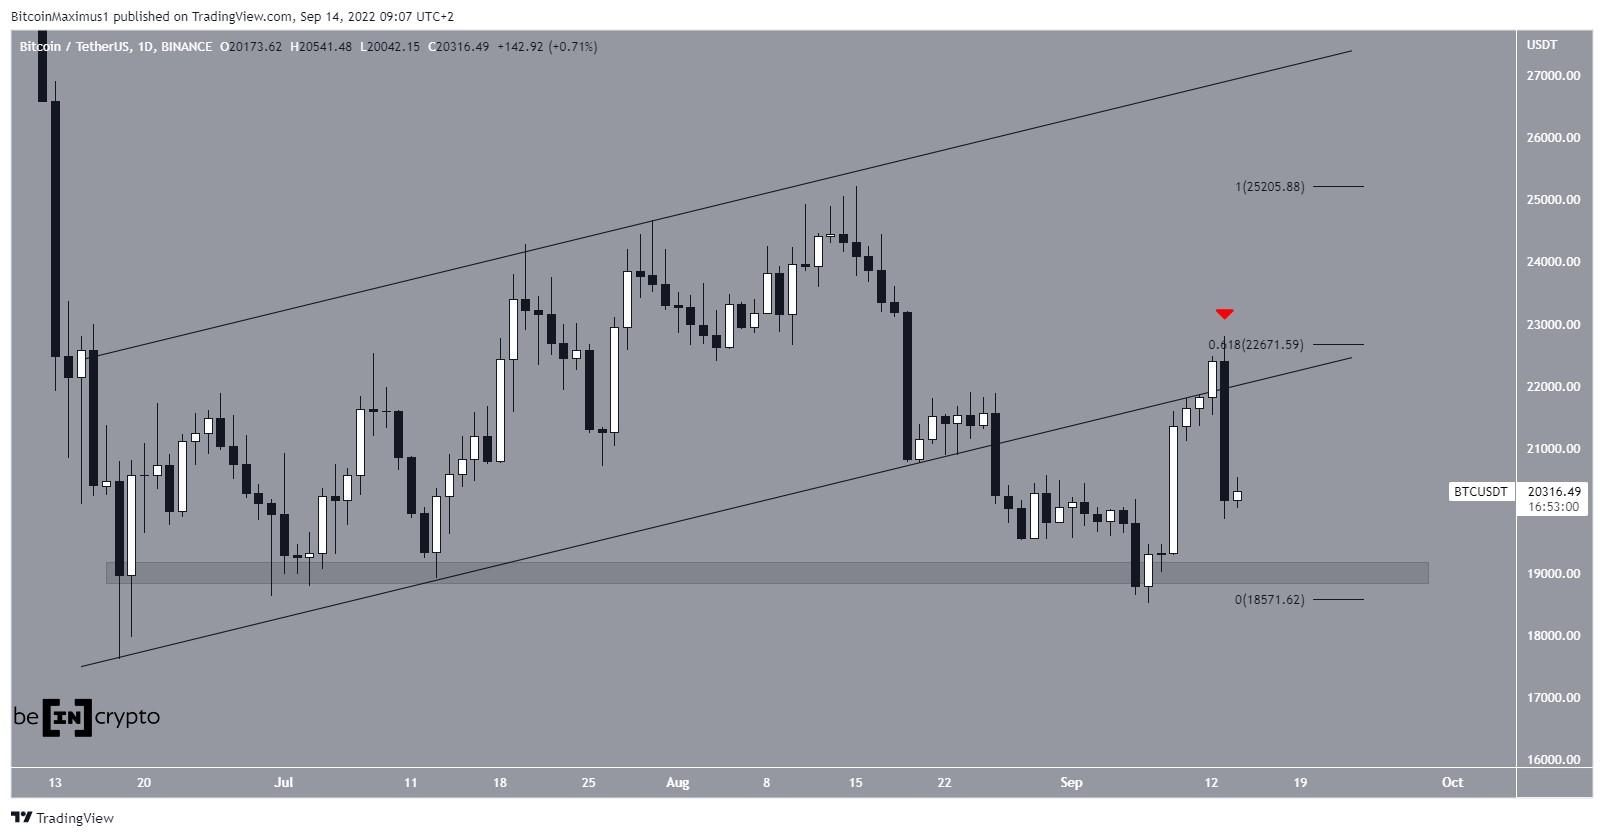
BTC/USDT Chart By TradingView BTC wave count analysisDue to the ongoing decrease, the primary wave count now suggests that Bitcoin has completed wave five of a leading diagonal, thus shaping the ascending wedge. The breakdown from the wedge suggests that this is part of wave A of an A-B-C corrective structure.
A decrease towards the 0.5-0.618 Fib retracement support levels between $20,500 and $21,400 would be expected prior to the continuation of the upward move.
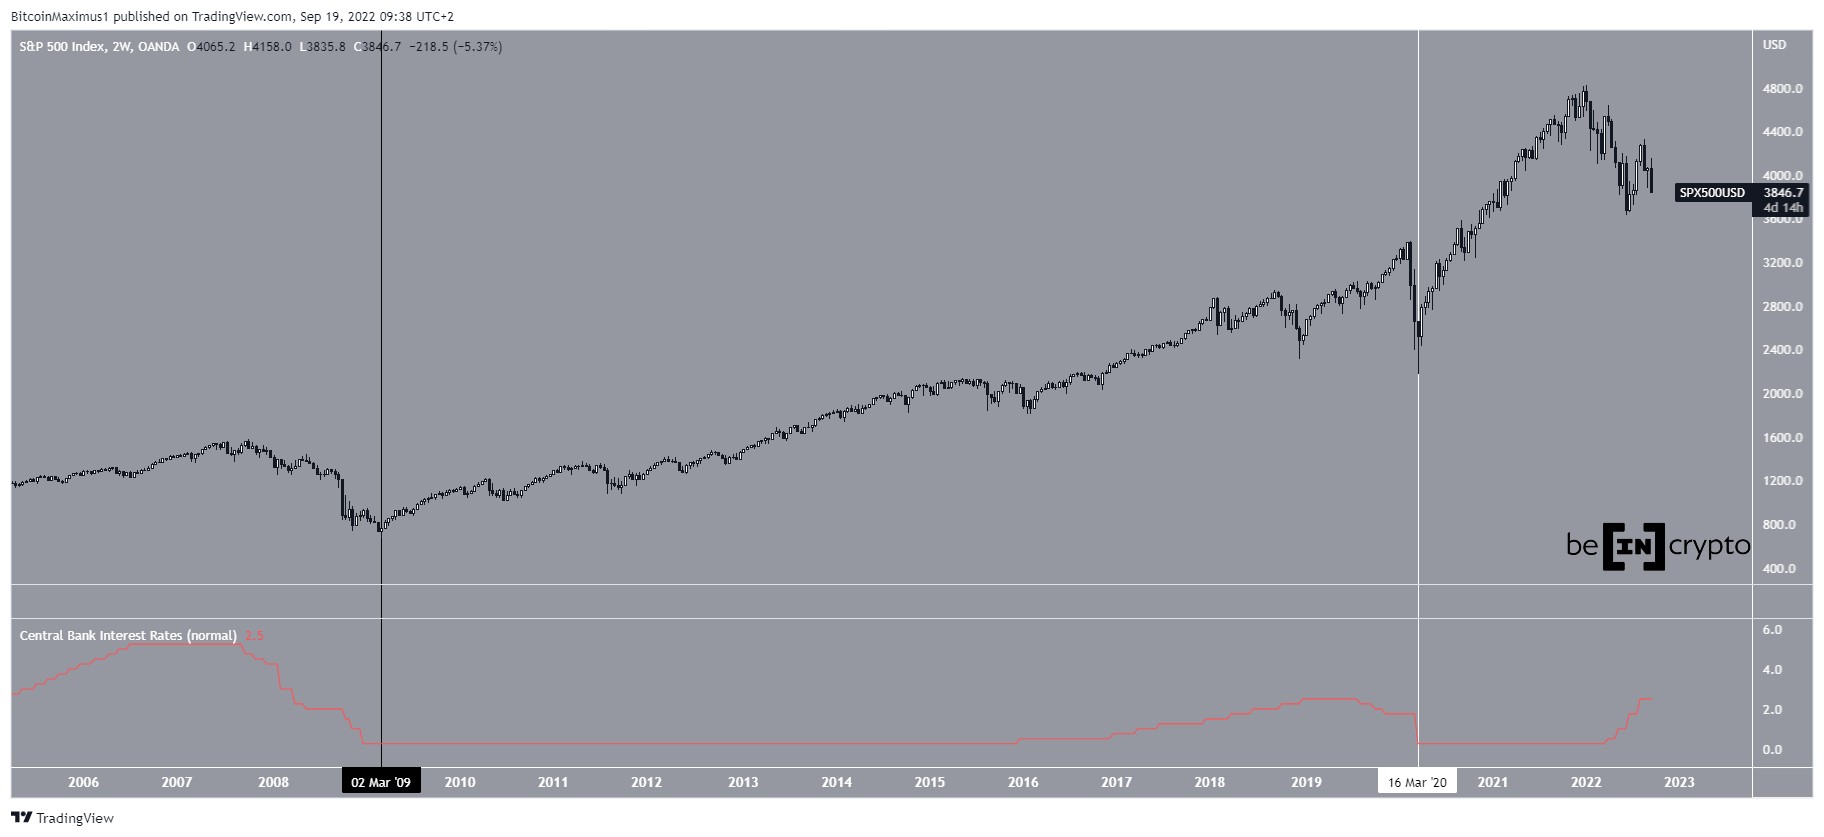
The most likely long-term wave count suggests that a bottom has already been reached.
BTC/USD Chart By TradingViewFor Be[in]Crypto’s previous Bitcoin (BTC) analysis, click here
The post Bitcoin (BTC) Slides Back to $23,000 Days After Reaching Multi-Month Highs appeared first on BeInCrypto.
origin »Bitcoin price in Telegram @btc_price_every_hour
Bitcoin (BTC) на Currencies.ru
|
|