2019-10-22 09:00 |
Bitcoin price is showing positive signs and is holding the $8,100 support area against the US Dollar. The price is likely to surpass the $8,280 and $8,300 resistance levels to continue higher. There is a short term declining channel or bullish flag pattern forming with resistance near $8,255 on the hourly chart of the BTC/USD pair (data feed from Kraken). The price is likely to gain strength if it settles above the $8,300 resistance zone.
Bitcoin price is attempting another upward move above $8,300 against the US Dollar. It seems like BTC price could soon revisit the key $8,400 and $8,500 resistance levels.
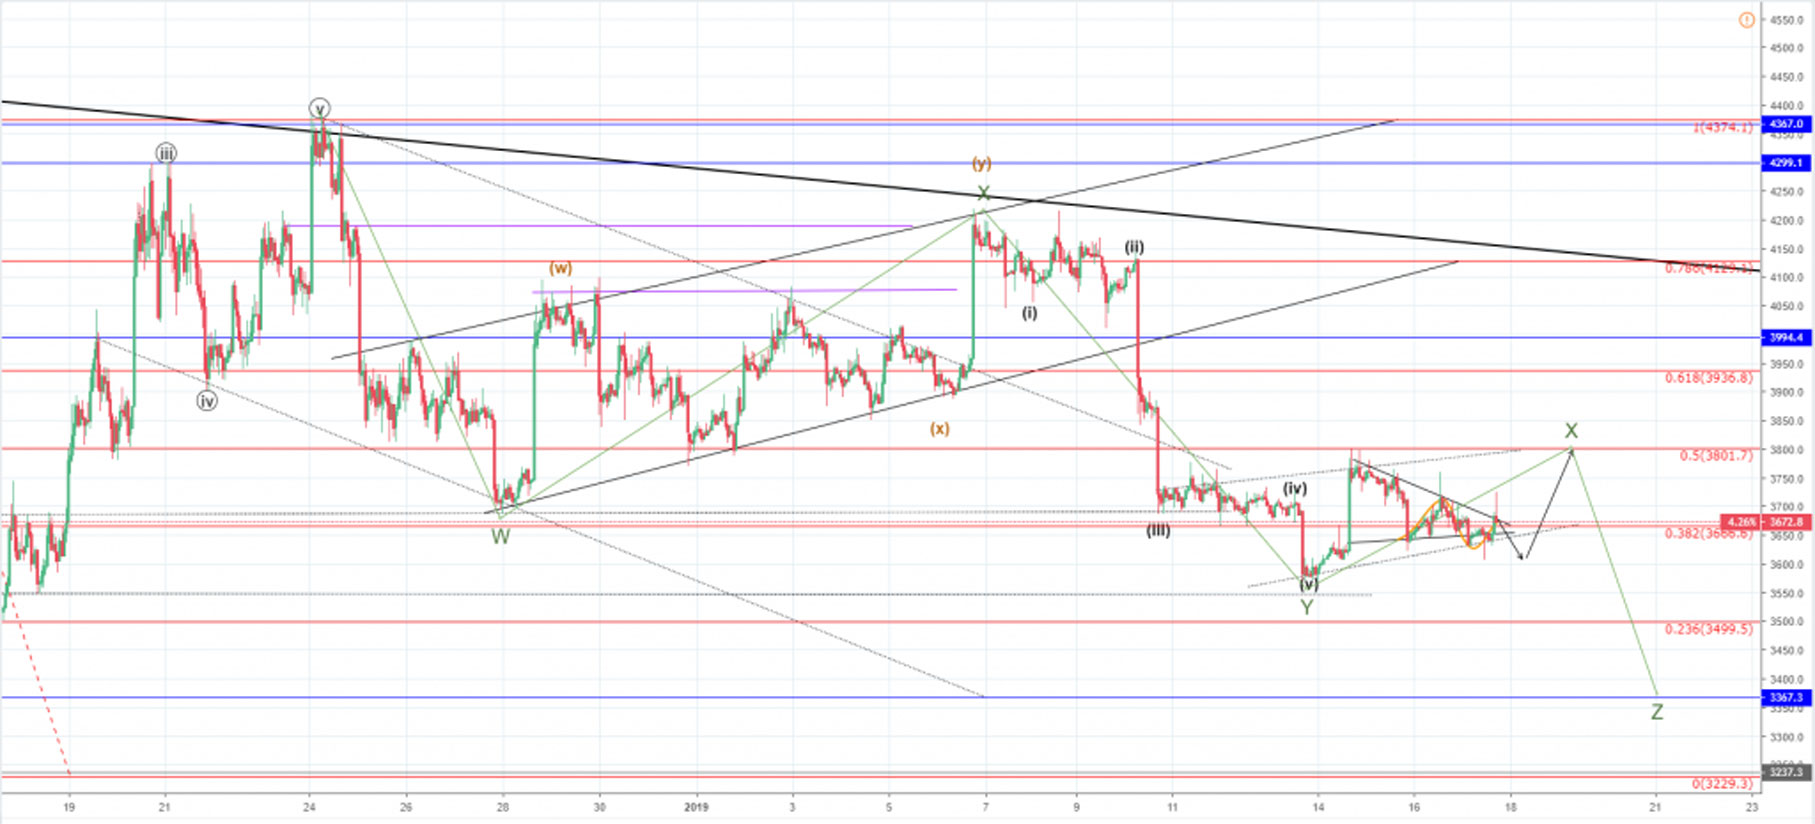
Bitcoin Price AnalysisRecently, we saw an upside break above the $8,100 and $8,200 resistances in bitcoin against the US Dollar. BTC price even settled above $8,100 and the 100 hourly simple moving average.
It opened the doors for more gains and the price recently spiked above $8,300. However, the price failed to stay above the $8,300 pivot level and trimmed most its gains. The last swing high was near $8,388 before the price declined below $8,300.
Moreover, there was a break below the 23.6% Fib retracement level of the upward move from the $7,885 low to $8,388 high. Finally, the price spiked below the $8,200 support area, but it remained stable above the $8,100 support area.
It seems like the 50% Fib retracement level of the upward move from the $7,885 low to $8,388 high acted as a strong support for bitcoin. More importantly, there is a short term declining channel or bullish flag pattern forming with resistance near $8,255 on the hourly chart of the BTC/USD pair.
On the upside, an immediate resistance is near the $8,260 and $8,280 levels. The main resistance is near the $8,300 level, above which the price could climb steadily towards the $8,400 resistance area.
Should there be an upside break above $8,400, the price may perhaps test the weekly resistance area near $8,500. On the downside, the $8,150 and $8,100 levels are important. If there is a bearish break below the $8,100 support, the price could test the $8,050 level and the 100 hourly SMA.
Bitcoin Price
Looking at the chart, bitcoin is showing a few positive signs above the $8,100 and $8,150 levels. Having said that, a successful close above $8,300 is must for the bulls to gain momentum. If they gain traction, there are high chances of a decent wave towards the $8,500 resistance.
Technical indicators:
Hourly MACD – The MACD is slowly moving into the bullish zone.
Hourly RSI (Relative Strength Index) – The RSI for BTC/USD is currently well above the 50 level.
Major Support Levels – $8,150 followed by $8,100.
Major Resistance Levels – $8,280, $8,300 and $8,400.
The post Bitcoin (BTC) Price Eyeing Another Leg Higher To $8,500 appeared first on NewsBTC.
origin »Bitcoin price in Telegram @btc_price_every_hour
Bitcoin (BTC) на Currencies.ru
|
|