2022-5-3 20:00 |
Be[In]Crypto takes a look at the Mayer Multiple (MM) and its components in order to determine if the long-term bias for bitcoin (BTC) is bullish or bearish.
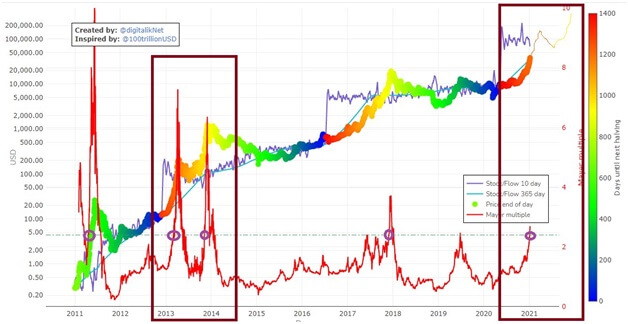
BTC And The 200-Day MAThe BTC price (black) is plotted alongside its 200-day moving average (MA), in order to determine if the trend is bullish or bearish. The trend can be considered bullish if the price is trading above this MA and vice versa.
Afterward, the 0.8 (green) and 2.4 (purple) oscillators of this MA are used in order to determine market cycle bottoms and tops respectively.
Historically, the 2.4 oscillator has been very precise in determining market cycle tops. All three highs (black circles) since 2013 have been made above this oscillator.
While the 0.8 oscillator has been relatively accurate in determining bottoms (red circles), it has not been very time sensitive. Bottoms usually took a long time to form after the first time BTC dropped below this MA.
More recently, BTC fell below this MA twice, on July 2021 and Jan 2022 respectively. Due to the fact that an upward movement has not yet begun, it remains to be seen if this will be the bottom.
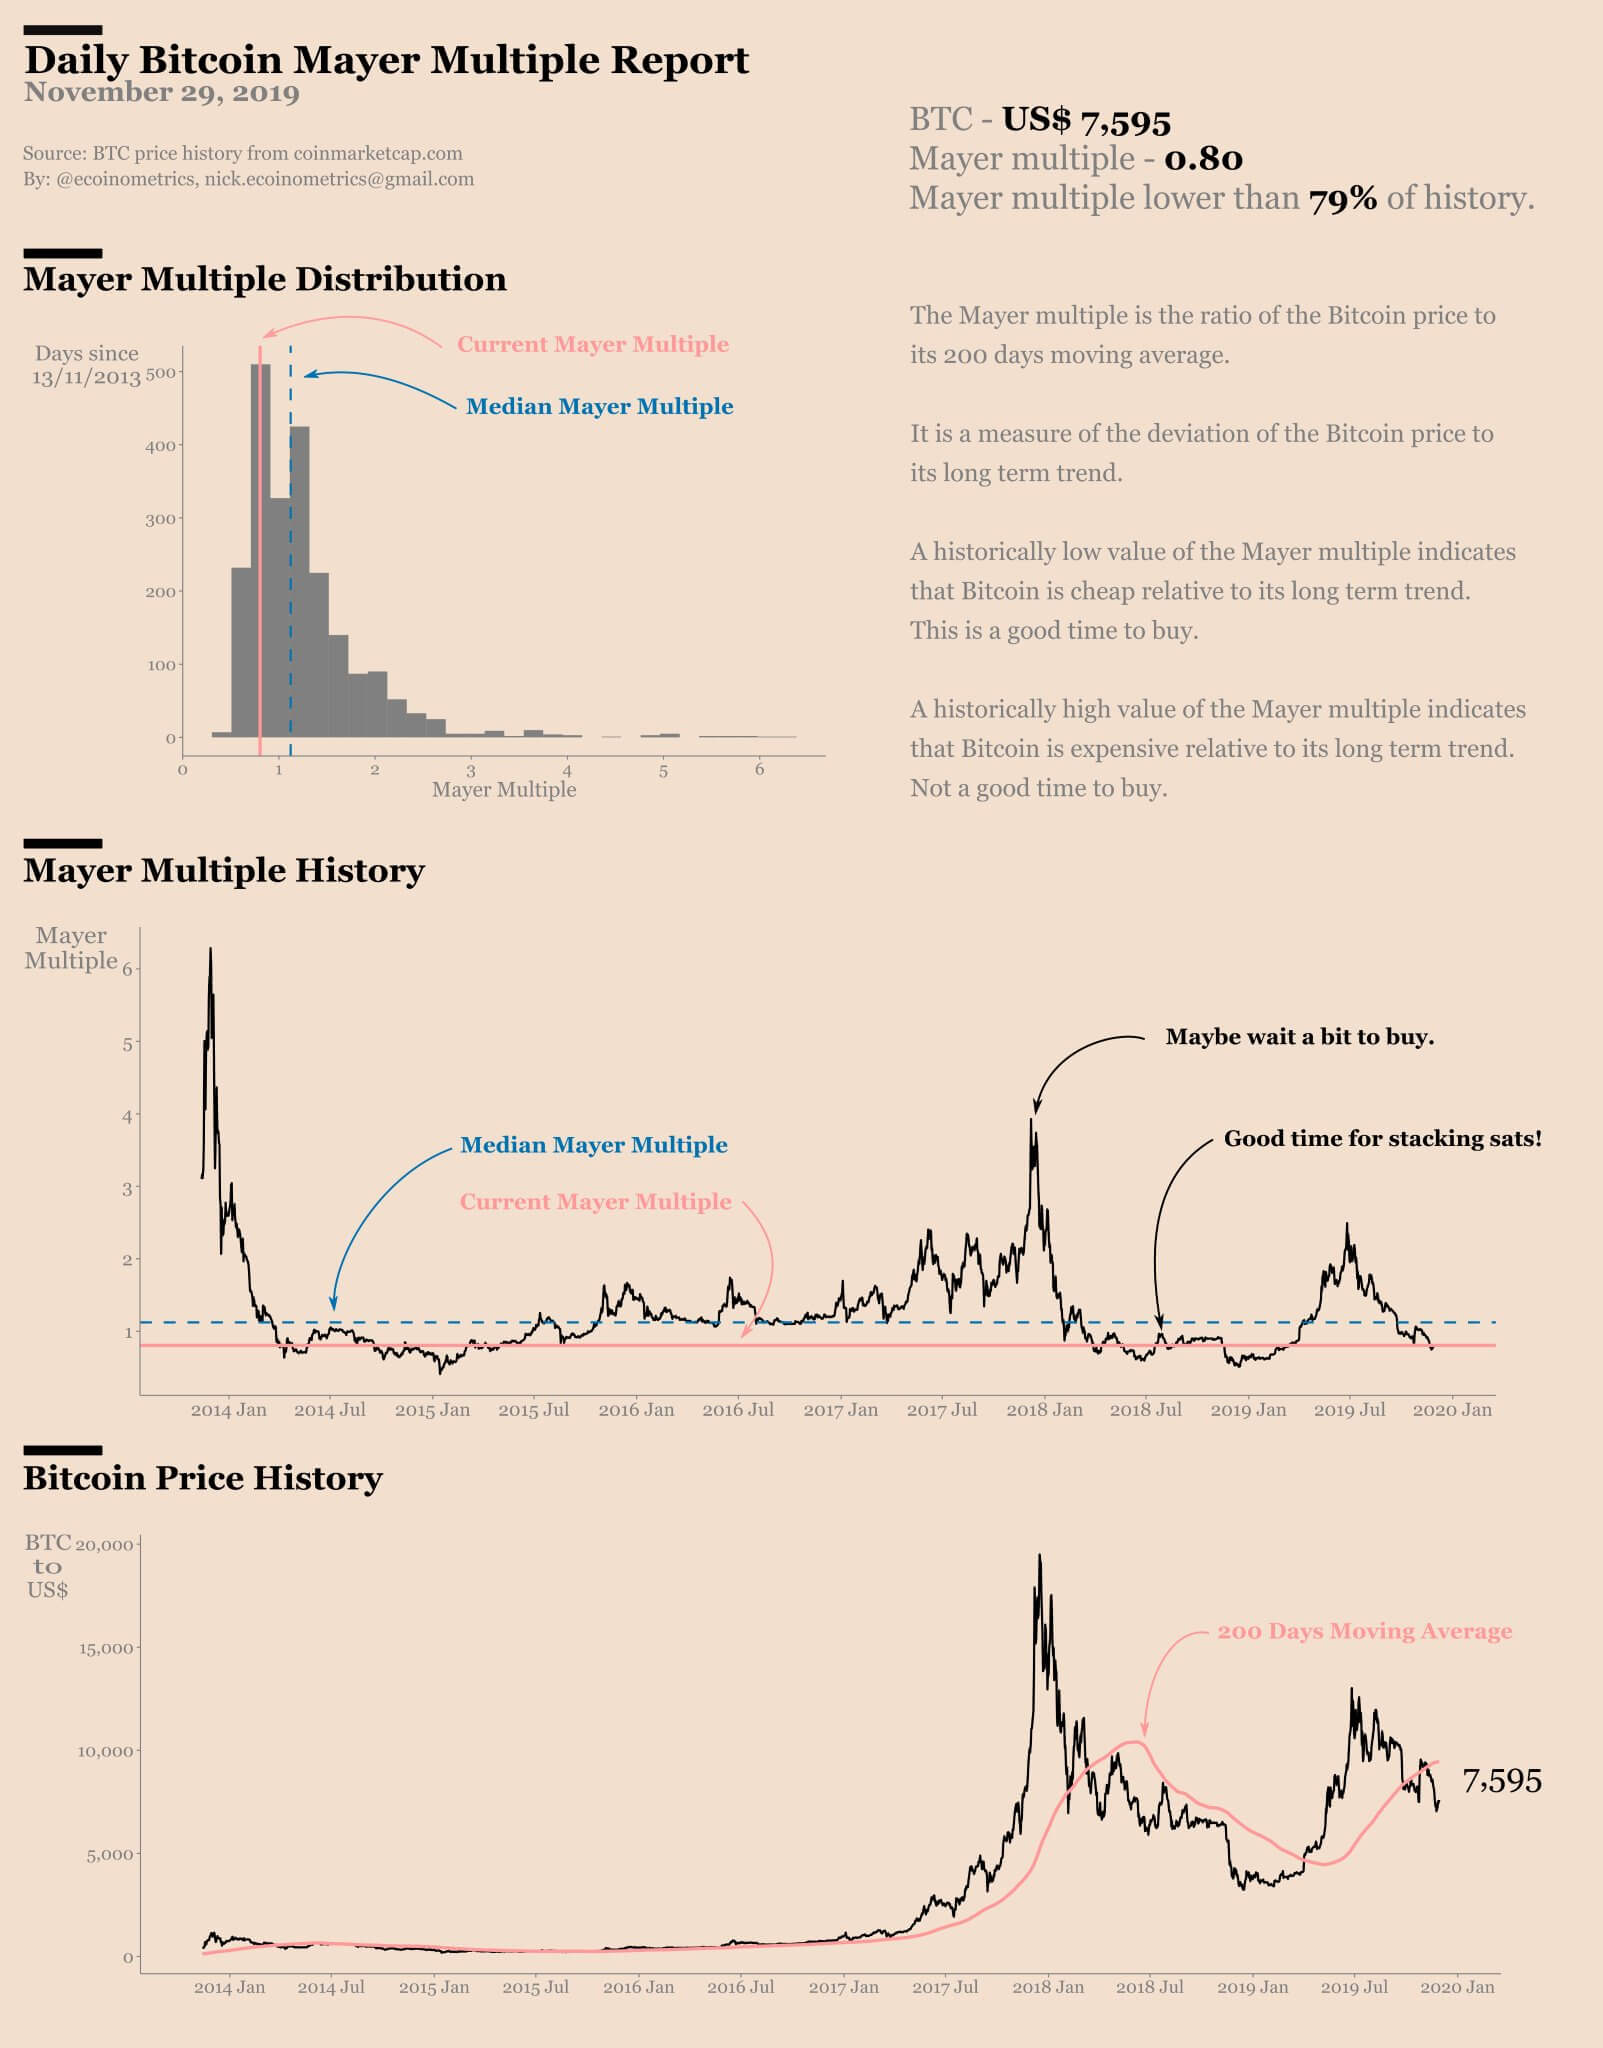
Chart By Glassnode Current readingThe Mayer Multiple is an oscillator that is calculated by taking the ratio between the BTC price and its 200-day moving average (MA).
The Mayer Multiple indicator (blue) is then created by taking the difference of the BTC price and its 200-day MA. The 0.8 (green) and 2.4 (purple) oscillator are then plotted in order to determine market tops and bottoms.
The method is more accurate than using the raw data, especially in predicting market bottoms.
The Dec 2018 and March 2020 bottom had values of 0.53 and 0.60, respectively.
The July 2021 and Jan 2022 bottoms had values of 0.68 and 0.75 respectively, hence they were not as oversold as the absolute bottoms of 2018 and 2020.
Currently, the Mayer Multiple has a reading of 0.81, just above its 0.8 oscillator.
Chart By Glassnode Similarity to 2018There are distinct similarities between the movement from the Dec 2017 high to the Dec 2018 bottom, and the movement from May 2021 to now.
After the first break below the 0.8 oscillator on April 2018, the indicator moved above and below it for a period of roughly five months, before capitulating to the Dec 2018 bottom.
During this period, the lowest value reached was 0.60 (black circle).
Chart By GlassnodeIn the current movement, Mayer Multiple crossed below its 0.8 oscillator on July, 2021 (black circle). Afterward, it traded above it until Feb 2022. This portion of the movement is dissimilar to that in 2018.
However, since Feb (red circle), the indicator has been hovering above and below the 0.8 oscillator.
The movement since Feb 2022 is similar to that in 2018. So, it could potentially warn of a capitulation event similar to that of Nov – Dec 2018.
A solid reclaim of the 0.8 line would go a long way in suggesting that a bottom has been reached and the trend is bullish instead.
Chart By GlassnodeFor Be[In]Crypto’s previous Bitcoin (BTC) analysis, click here
The post Bitcoin (BTC) on-Chain Analysis – Mayer Multiple Consolidates in Oversold Region appeared first on BeInCrypto.
origin »Bitcoin price in Telegram @btc_price_every_hour
Bitcoin (BTC) на Currencies.ru
|
|