2021-11-5 11:06 |
The Bitcoin (BTC) consolidation below resistance has been dragging on for a considerable period of time, casting some doubt on whether the short-term trend is bullish. However, the long-term trend is still decisively bullish, suggesting a new all-time high is likely in the medium term.
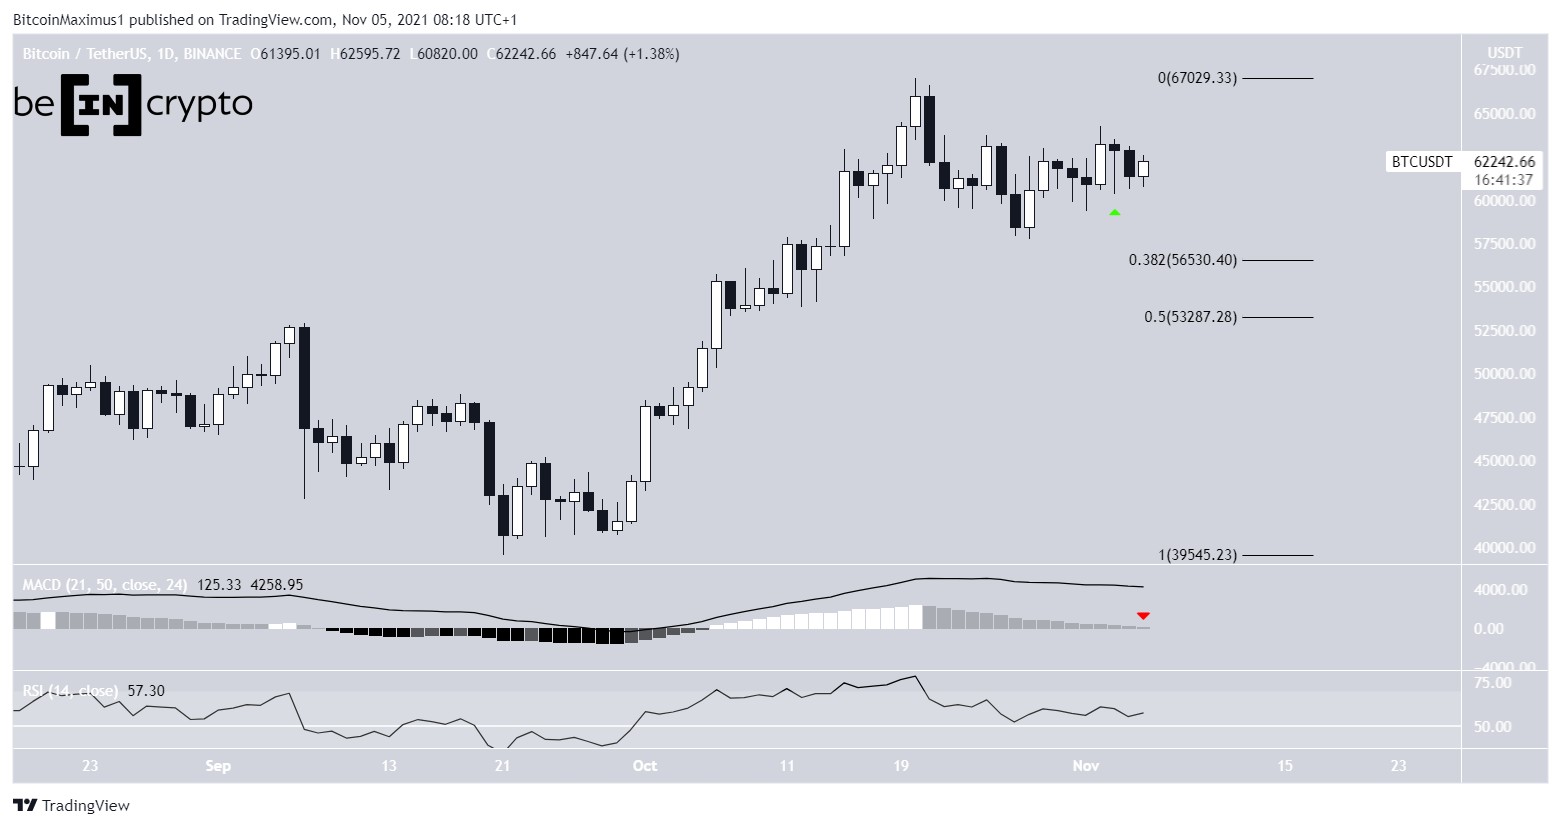
After bouncing considerably on Nov 3 and creating a long lower wick (green icon), BTC negated all of its gains with a bearish candlestick the next day.
Technical indicators continue to show mixed readings.
The MACD, which is created by short and long-term moving averages (MA), has created 15 successive lower histogram bars. Furthermore, it’s very close to crossing into negative territory. This would mean that the short-term MA is moving slower than the long-term one and is a bearish sign. The previous time this occurred was just before BTC reached its September lows.
However, the RSI, which is a momentum indicator, is still above 50, signaling an intact bullish trend.
The closest support levels are found at $56,530 and $53,300. These are the respective 0.382 and 0.5 Fib retracement support levels.
BTC Chart By TradingView Future BTC movementThe two-hour chart shows that BTC is following an ascending support line since Sept 27. Each touch of this line (green icons) has been combined with a long lower wick, which is a sign of buying pressure.
However, technical indicators are similarly mixed. The RSI is right at the 50-line while the MACD is at 0 — both signs of an undetermined trend.
The main resistance area is found at $63,530. This is the 0.618 Fib retracement resistance level and a horizontal resistance area. On Nov 3, BTC seemingly broke out above it (green circle) but fell back below shortly after, rendering the breakout a deviation.
Until BTC either breaks out above this area or breaks down from the support line, the direction of the short-term trend cannot be confidently determined.
BTC Chart By TradingView Wave countThere are two possibilities for the wave count. While both suggest that a new all-time high will transpire in the medium term, the short-term movement differs between the two.
The upward movement since Oct 27 looks corrective. This is because of the considerable overlap between the short-term increases. Therefore, it’s possible that BTC is in a 1-2/1-2 wave formation. In this case, BTC could drop towards the previously outlined support at $53,300 before moving upwards.
BTC Chart By TradingViewDue to the short-term upward movement looking corrective, it’s also possible that wave one is not yet complete and BTC is still in sub-wave four (black), which has taken the shape of a triangle.
In this case, BTC would increase towards $70,000 before correcting in the short term and then resuming its upward move towards a new all-time high.
Whether BTC breaks down from the short-term ascending support line or breaks out from the $63,500 resistance area will likely determine which of the wave counts will transpire.
BTC Chart By TradingViewFor BeInCrypto’s latest Bitcoin (BTC) analysis, click here.
The post Bitcoin (BTC) Drops Back But Bullish Trend Remains Intact appeared first on BeInCrypto.
origin »Bitcoin price in Telegram @btc_price_every_hour
Bitcoin (BTC) на Currencies.ru
|
|