2021-6-4 09:19 |
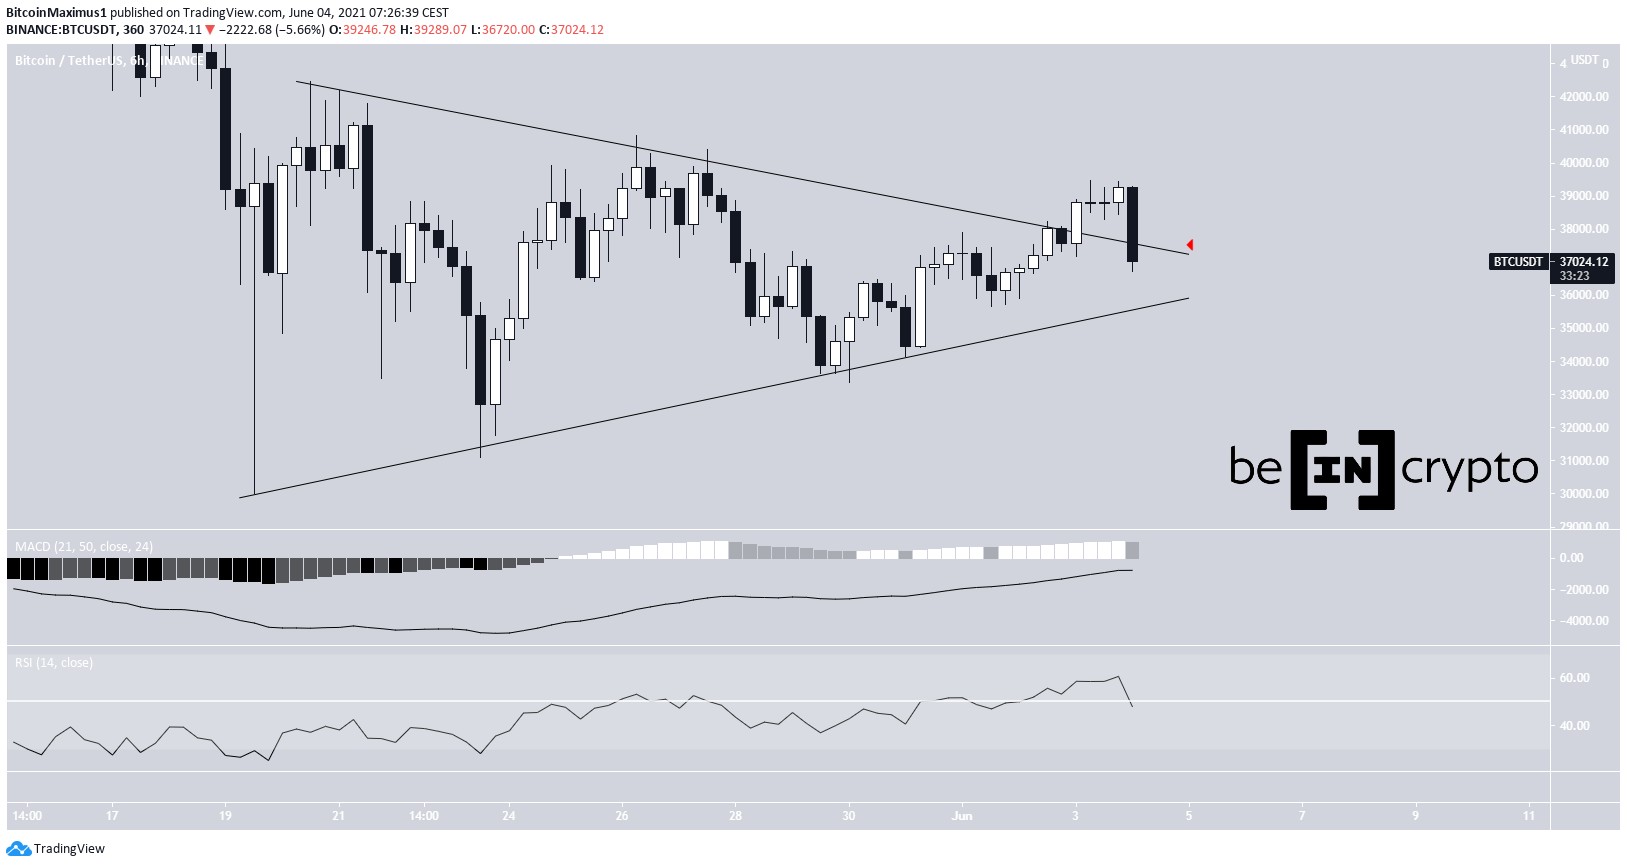
Bitcoin (BTC) has broken out from a symmetrical triangle and returned to validate it as support after.
However, the upward movement could not be sustained and the price has returned back to pre-breakout levels.
BTC breakout and retestBTC had been trading inside a symmetrical triangle since reaching a local low on May 19. On June 3, it managed to break out, reaching a high of $39,476 shortly after.
However, it has been decreasing since, falling back inside the triangle (red icon).
While the MACD and RSI are still bullish, they are both at critical points. A continued decrease would cause them to turn bearish.
BTC Chart By TradingViewDespite the short-term decrease, technical indicators in the daily time frame are still bullish. The Stochastic oscillator is very close to making a bullish cross and both the MACD and RSI are still increasing. In addition, the latter’s bullish divergence trend (blue) is still intact.
The movement today is crucial since an ongoing decrease could create a bearish engulfing candlestick. Moreover, as outlined in the previous section, it would cause short-term indicators to turn bearish.
The next resistance areas are found at $41,270 and $48,230.
BTC Chart By TradingView Wave countsThe wave count is not entirely clear.
While less likely, the bearish scenario is still in play. This is due to the lack of an upward movement above the $40,904 high of the potential C wave (red line).
The pattern looks irregular since the E wave is the longest when measuring the length it took to transpire. However, it is still valid as a fourth wave triangle as long as the high is not taken out.
BTC Chart By TradingViewNevertheless, the bullish scenario is still more likely.
In it, the entire triangle is part of the B wave of an A-B-C corrective structure. Therefore, the price would be expected to move upwards after another drop towards the support line.
This pattern would be invalidated with a decrease below the wave C low at $33,377.
However, a bounce at the support line of $35,700 would be much more likely.
As per the wave count, whether $33,377 or $40,904 gets reached first will likely determine the direction of the future trend.
BTC Chart By TradingViewFor BeInCrypto’s previous bitcoin (BTC) analysis, click here.
The post Bitcoin (BTC) Drops After Failure to Sustain Breakout appeared first on BeInCrypto.
origin »Bitcoin price in Telegram @btc_price_every_hour
Bitcoin (BTC) на Currencies.ru
|
|


