2022-6-1 12:30 |
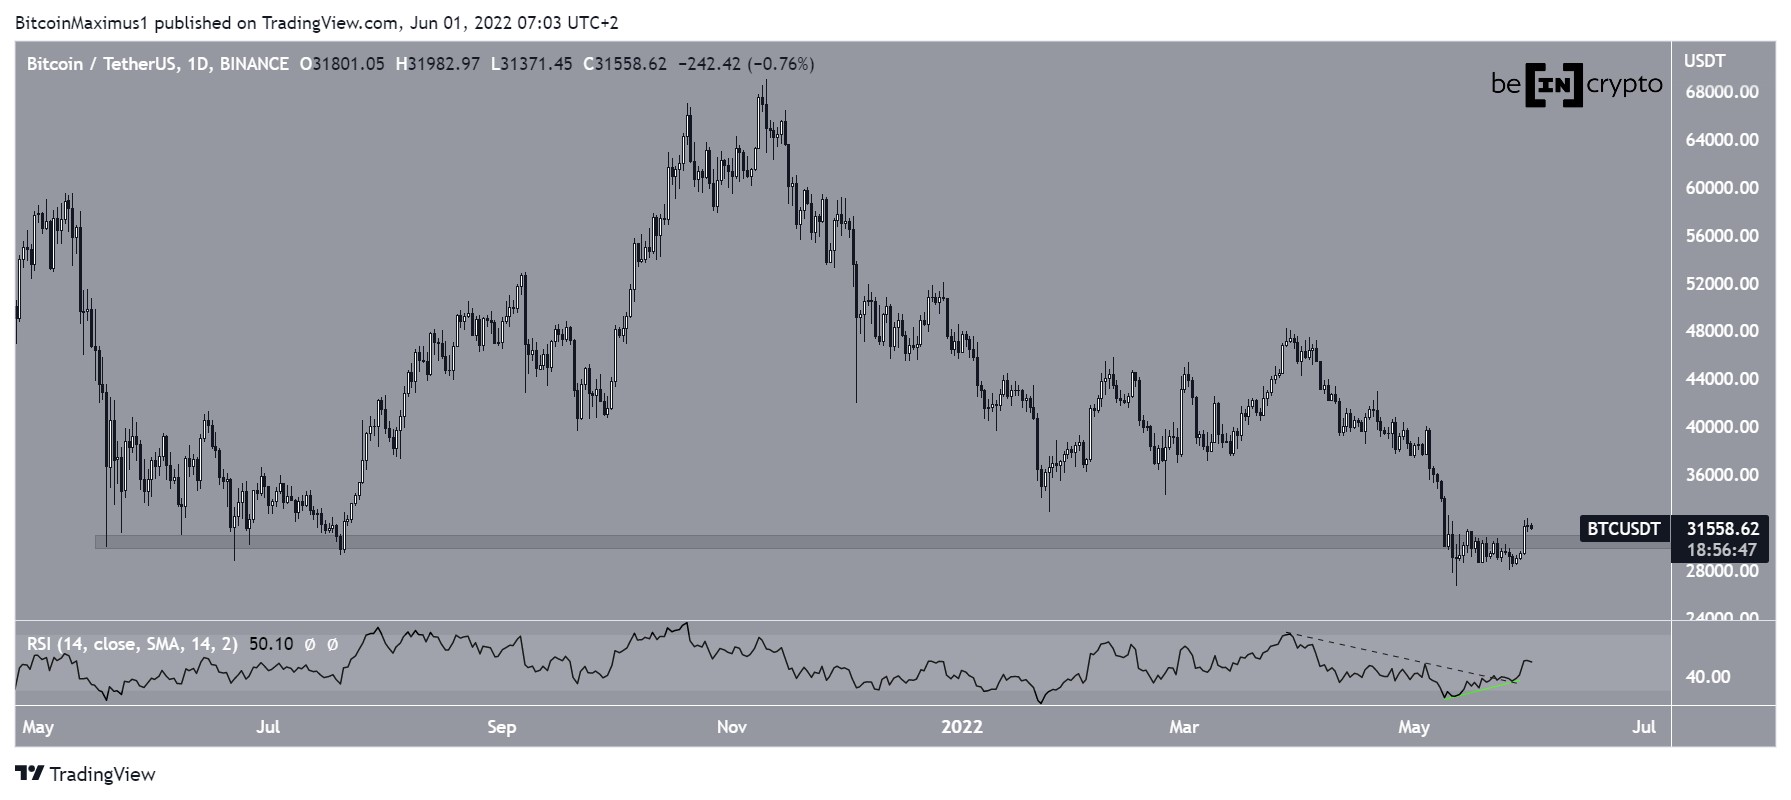
Bitcoin (BTC) has been increasing since May 12 and is in the process of validating the $30,500 horizontal area as support.
BTC has been increasing since reaching a low of $26,700 on May 12. The upward movement has so far led to a high of $32,399 on May 31.
Prior to the ongoing increase, the daily RSI generated a significant bullish divergence (green line) and also broke out from a bearish trendline (dashed).
Another important development is the reclaim of the $30,500 horizontal area. While it initially seemed that BTC had broken down from this level, the recent movement suggests otherwise. If the price manages to validate it as support, it would be a very bullish development that would be expected to lead to higher prices.
BTC/USDT Chart By TradingView Ongoing bounceA closer look at the daily chart shows that the price has been falling underneath a descending resistance line since March. The line was more recently validated on May 5 and currently coincides with the 0.5 Fib retracement resistance level at $33,350.
The RSI breakout from the trendline suggests that the price will be successful in breaking out from the line. But, the fact that the RSI is still trading below 50 casts some doubt on this possibility.
So there are two crucial resistance levels in the form of the descending resistance line and the horizontal support area at $30,500. Whether BTC breaks out from the line or falls below the support area will likely determine the direction of the future trend.
BTC/USDT Chart By TradingView BTC wave count analysisSince the May 12 low, it is possible that the price has been trading inside an ascending parallel channel. If so, it is currently in the middle of the channel (red circle).
In addition to this, BTC could be in the C wave of an A-B-C corrective structure.
Giving waves A:C a 1:1 ratio would lead to a high of $34,000. This also coincides with the resistance line of the channel.
BTC/USD Chart By TradingViewA closer look at the sub-wave count supports this possibility, indicating that the price is in sub-wave four of a five-wave upward movement. The hidden bullish divergence that has been developing in the two-hour RSI also supports this interpretation.
The longer-term wave count also suggests that the price might have bottomed.
BTC/USDT Chart By TradingViewFor Be[in]Crypto’s previous bitcoin (BTC) analysis, click here
The post Bitcoin (BTC) Continues to Consolidate Above $31,000 appeared first on BeInCrypto.
origin »Bitcoin price in Telegram @btc_price_every_hour
Bitcoin (BTC) на Currencies.ru
|
|