2021-12-13 12:51 |
Bitcoin (BTC) initiated a strong bounce on Dec 5 but has failed to decisively move above the $50,000 area. Short-term signals suggest it could do so in the near future.
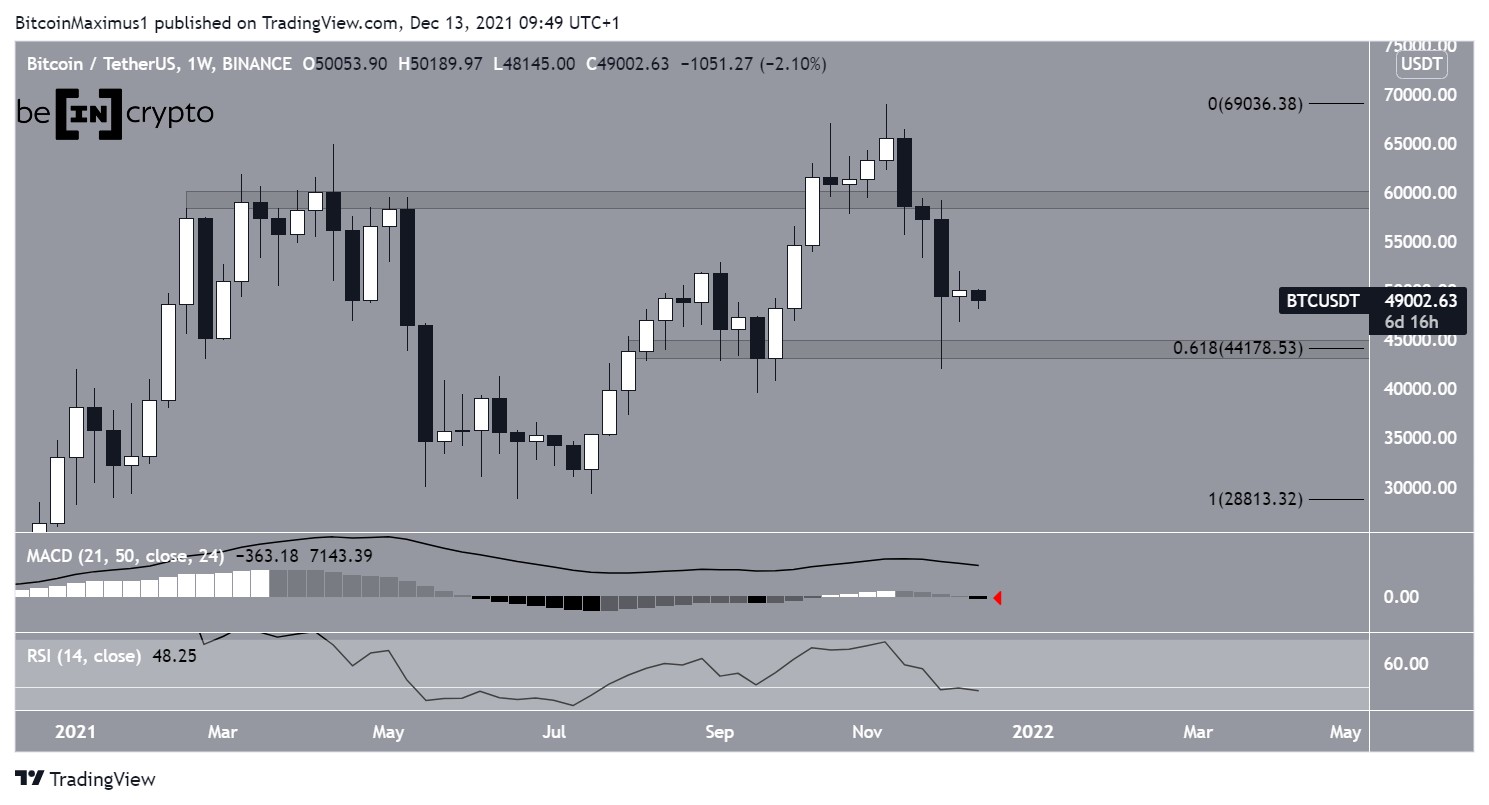
Bitcoin has a relatively neutral week throughout Dec 6-12. While it hovered between $45,670 and $51,930, the opening and closing prices were only $600 apart.
Technical indicators are showing bearish signs.
The MACD, which is created by short and long-term moving averages is falling. Furthermore, its histogram is in the process of creating a negative momentum bar (red icon). This means that the short-term MA is losing ground relative to the long-term average.
In addition to this, the RSI is in the process of moving below 50 — normally indicative of a bearish trend.
However, BTC is still trading above the 0.618 Fib retracement support level of $44,200. This is also a horizontal support area.
BTC Chart By TradingView BTC attempts to reclaim supportUnlike the weekly chart, the daily outlook appears to be slightly more bullish.
While BTC did break down from an ascending support line on Dec 4, it has been moving upwards since then and could possibly attempt to reclaim the line soon.
More importantly, the MACD has created several higher momentum bars (green icon), meaning that the trend may be reversing.
Similarly, the RSI is moving upwards, even though it’s still below 50.
Reclaiming the support line and an RSI move above 50 would be required for the bullish reversal to be confirmed.
BTC Chart By TradingViewThe six-hour chart shows that BTC has been trading inside a descending parallel channel since the Nov 10 all-time high price of $69,000.
Such channels usually contain corrective movements, meaning that a breakout from it would be likely.
BTC has also reclaimed the midline of the channel, a sign that a potential breakout could follow.
In addition to this, the MACD and RSI are both moving upwards.
If a breakout transpires, the closest resistance levels would be found between $55,525 and $58,700. This target range is the 0.5-0.618 Fib retracement resistance level.
BTC Chart By TradingView Short-term bounceThe hourly chart shows that BTC has bounced at the 0.5 Fib retracement support level at $47,000 (green icon), and initiated an upward move.
As long as BTC holds this area as a higher low, the possibility for a breakout remains strong.
BTC could potentially drop to the 0.618 Fib retracement level and create a slightly lower low (green circle), but the bullish structure would still remain intact as long as it does not break down.
BTC Chart By TradingViewFor BeInCrypto’s previous Bitcoin (BTC) analysis, click here.
The post Bitcoin (BTC) Consolidates Just Below $50,000 After Neutral Week appeared first on BeInCrypto.
origin »Bitcoin price in Telegram @btc_price_every_hour
Bitcoin (BTC) на Currencies.ru
|
|


