2021-11-2 20:45 |
In addition to its new all-time high, Bitcoin (BTC) reached its highest ever monthly close of $61,299 in October.
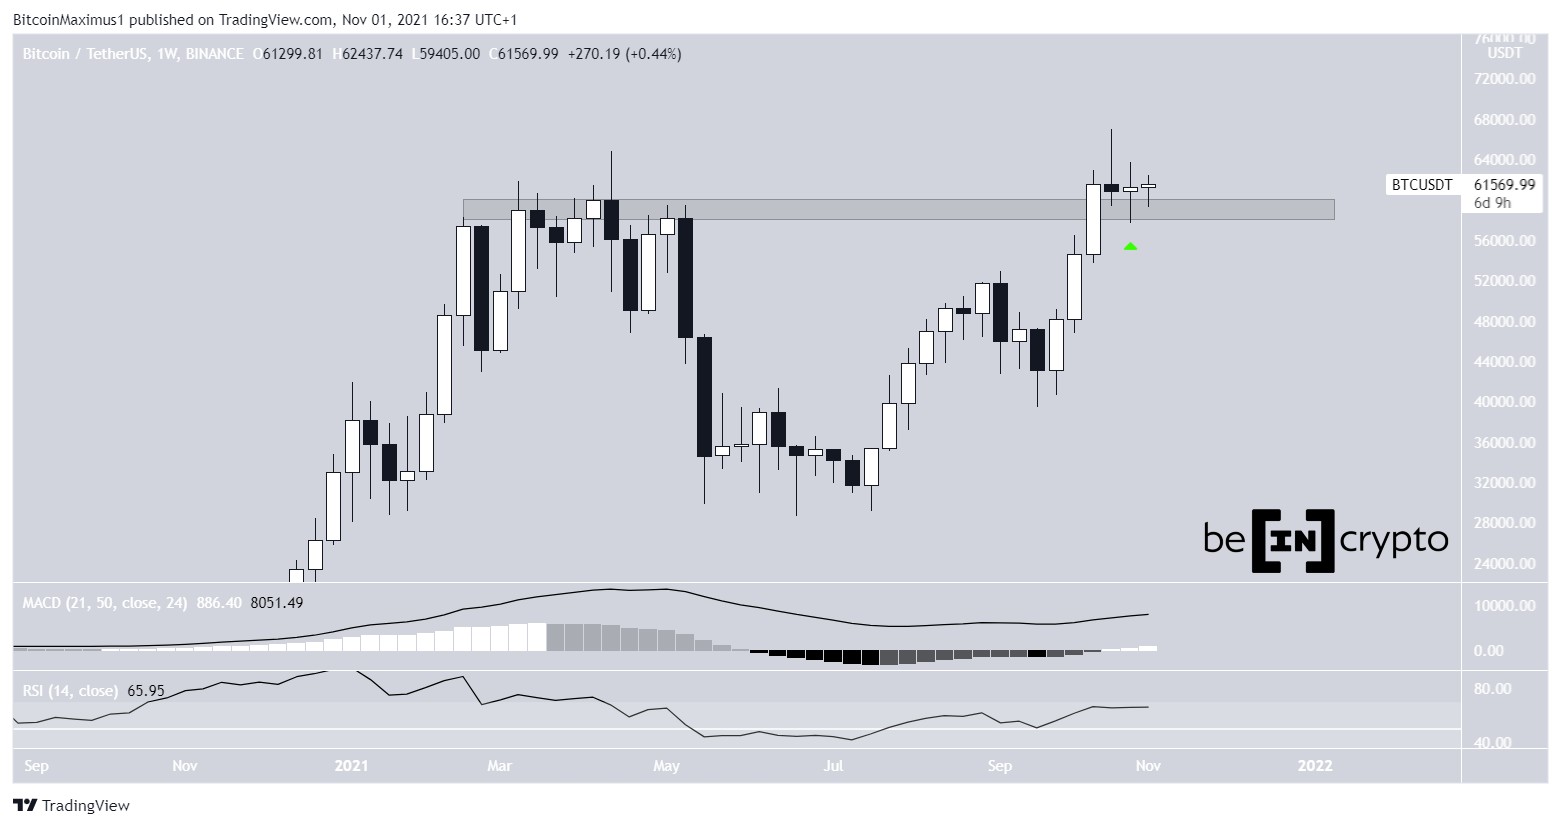
During the week of Oct 25-31, BTC increased only slightly. However, while the magnitude of the movement was not significant, its shape was.
BTC validated the $59,000 area as support and created a long lower wick (green icon). This is a sign of buying pressure.
Furthermore, the area previously acted as the all-time high resistance during March – May. Its reclaim and subsequent validation as support is a strong bullish sign that indicates BTC is likely to head higher.
Furthermore, technical indicators are also bullish.
The MACD, which is created by a short- and a long-term moving average (MA), is positive and increasing. This means that the short-term trend is increasing at a faster rate than the long-term one.
The RSI, which is a momentum indicator, is positive and increasing. This means that the trend is getting stronger alongside the price increase.
Chart By TradingViewThe monthly candlestick for BTC also shows the highest ever close at $62,199. The previous highest close was in March, at $58,740.
This is another bullish signs that aligns with the readings from the weekly time-frame.
Chart By TradingView BTC attempts reversalDespite the absolute bullishness from the weekly and monthly time-frames, the daily time-frame is still showing signs of weakness. Besides the ongoing price decrease, this is visible in the decreasing MACD and RSI.
The drop in the MACD is especially worrisome, since it has generated 12 successive lower momentum bars. A higher momentum bar is required in order for a potential reversal to ensue.
However, BTC has bounced just above the 0.382 Fib retracement support level at $56,570. However, there is stronger support between $52,450 and $53,300, created by both Fib and horizontal levels.
Chart By TradingViewHowever, the shorter-term six-hour chart is also bullish. It shows that BTC has broken out from a descending parallel channel and validated it as support afterwards (green icon).
Such channels usually contain corrective movements, meaning that a breakout and resumption of the upward trend is likely afterwards. This was solidified by the breakout and subsequent validation as support.
A reclaim of the $63,530 resistance area would confirm that the trend is bullish and BTC is heading higher towards yet another all-time high price.
Chart By TradingViewFor BeInCrypto’s previous Bitcoin (BTC) analysis, click here.
What do you think about this subject? Write to us and tell us!
The post Bitcoin (BTC) Closes Month Above $60,000 for First Time in History appeared first on BeInCrypto.
origin »Bitcoin price in Telegram @btc_price_every_hour
Bitcoin (BTC) на Currencies.ru
|
|


