2021-6-14 10:31 |
Bitcoin (BTC) began to fall the week of June 7-14 but reversed its decrease and bounced back up.
It has broken out from a short-term descending resistance line and is now approaching the first resistance area at $43,250.
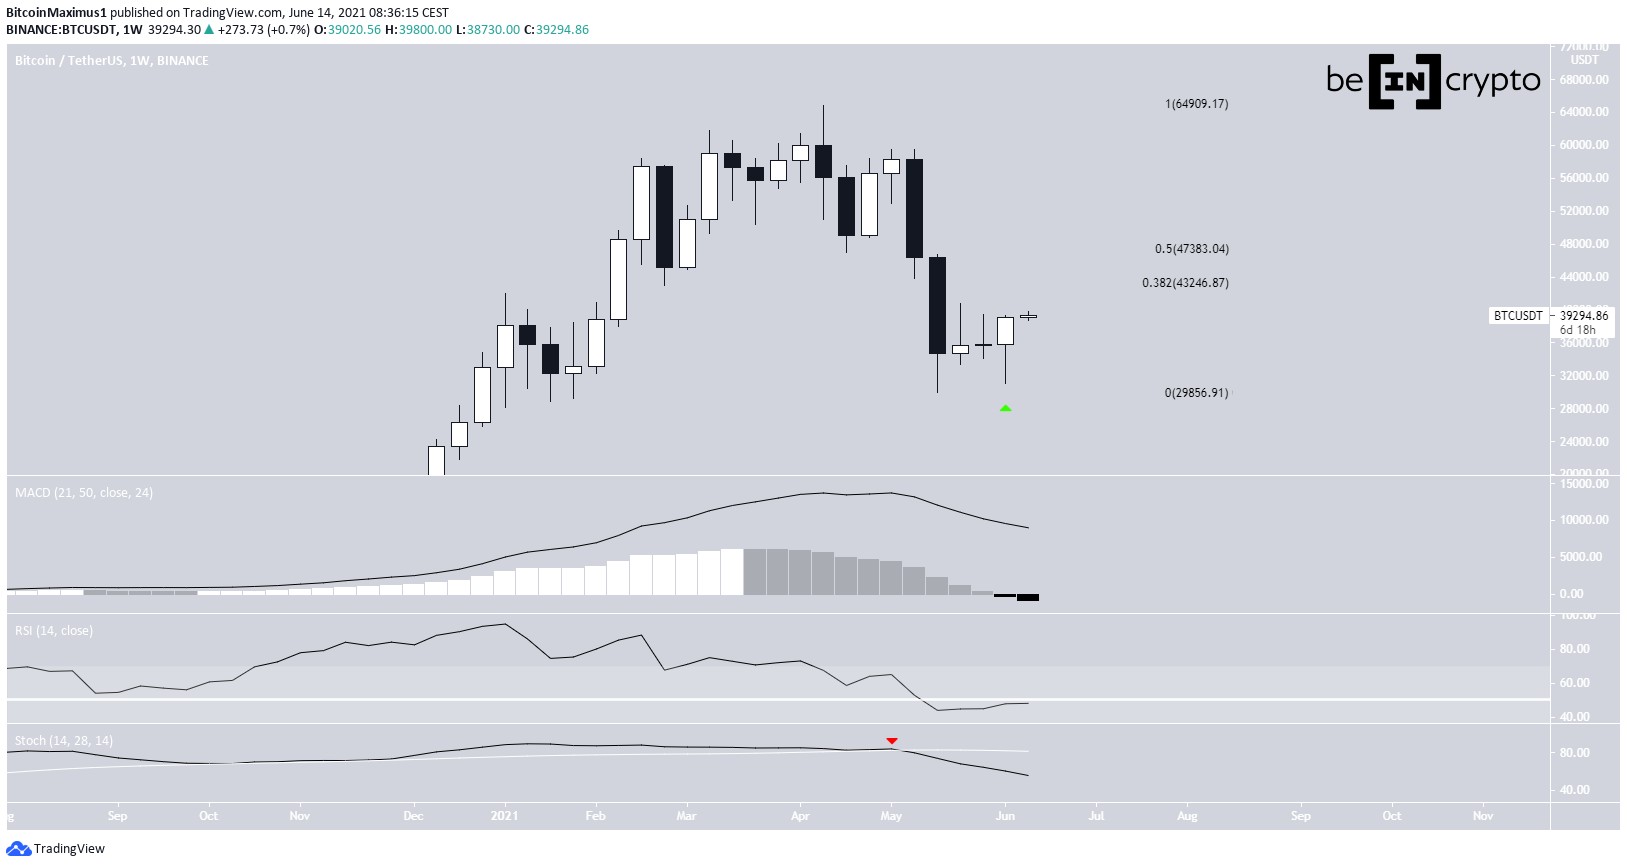
Weekly bitcoin closeBTC began the week by falling to a low of $31,000. However, it bounced right back up, leaving a long lower wick in place and reaching a bullish close. The weekly high was at $39,380.
Despite the bullish candlestick, technical indicators are firmly bearish. The MACD is decreasing and its histogram has crossed into negative territory. This has historically been a bearish sign.
The Stochastic oscillator has made a bearish cross (red icon) and the RSI has crossed below the 50-line.
The next closest resistance areas are at $43,250 and $47,400. These targets are the respective 0.382 and 0.5 Fib retracement resistance levels.
BTC Chart By TradingView Ongoing breakoutThe daily chart provides a much more bullish outlook. BTC created a bullish engulfing candlestick (highlighted) on June 13, breaking out from a short-term descending resistance line.
In addition to this, technical indicators are bullish. The MACD histogram has crossed into positive territory, the RSI has moved above 50, and the Stochastic oscillator has made a bullish cross.
Therefore, an increase towards the previously outlined resistance levels would be likely.
BTC Chart By TradingView BTC wave countSince May 19, BTC has been trading inside an ascending parallel channel. In it, BTC is potentially completing an A-B-C corrective structure.
The resistance line of the channel is at $43,950. In addition to this, a high of $43,950 would give waves A:C a 1:1 ratio, a common occurrence in such structures.
BTC Chart By TradingViewIn the longer term, it’s possible that the entire movement is wave four (orange) of a five-wave bearish impulse. If so, the proposed high near $44,000 would also complete a fourth wave pullback (red circle).
As outlined in BeInCrypto’s wave count article, an increase above $47,000 would indicate that the longer-term count is bullish instead.
Therefore, whether the price reaches a top near $44,000 or continues to increase above $47,000 will be a crucial development that likely determines the direction of the longer-term trend.
BTC Chart By TradingViewFor BeInCrypto’s previous bitcoin (BTC) analysis, click here.
The post Bitcoin (BTC) Aims for $40,000 After Bullish Week appeared first on BeInCrypto.
origin »Bitcoin price in Telegram @btc_price_every_hour
Bitcoin (BTC) на Currencies.ru
|
|