2021-12-13 19:06 |
Binance Coin (BNB) is consolidating above the previous resistance area and has validated it as support. While there are no bullish reversal signs from technical indicators, BNB is trading in a bullish pattern.
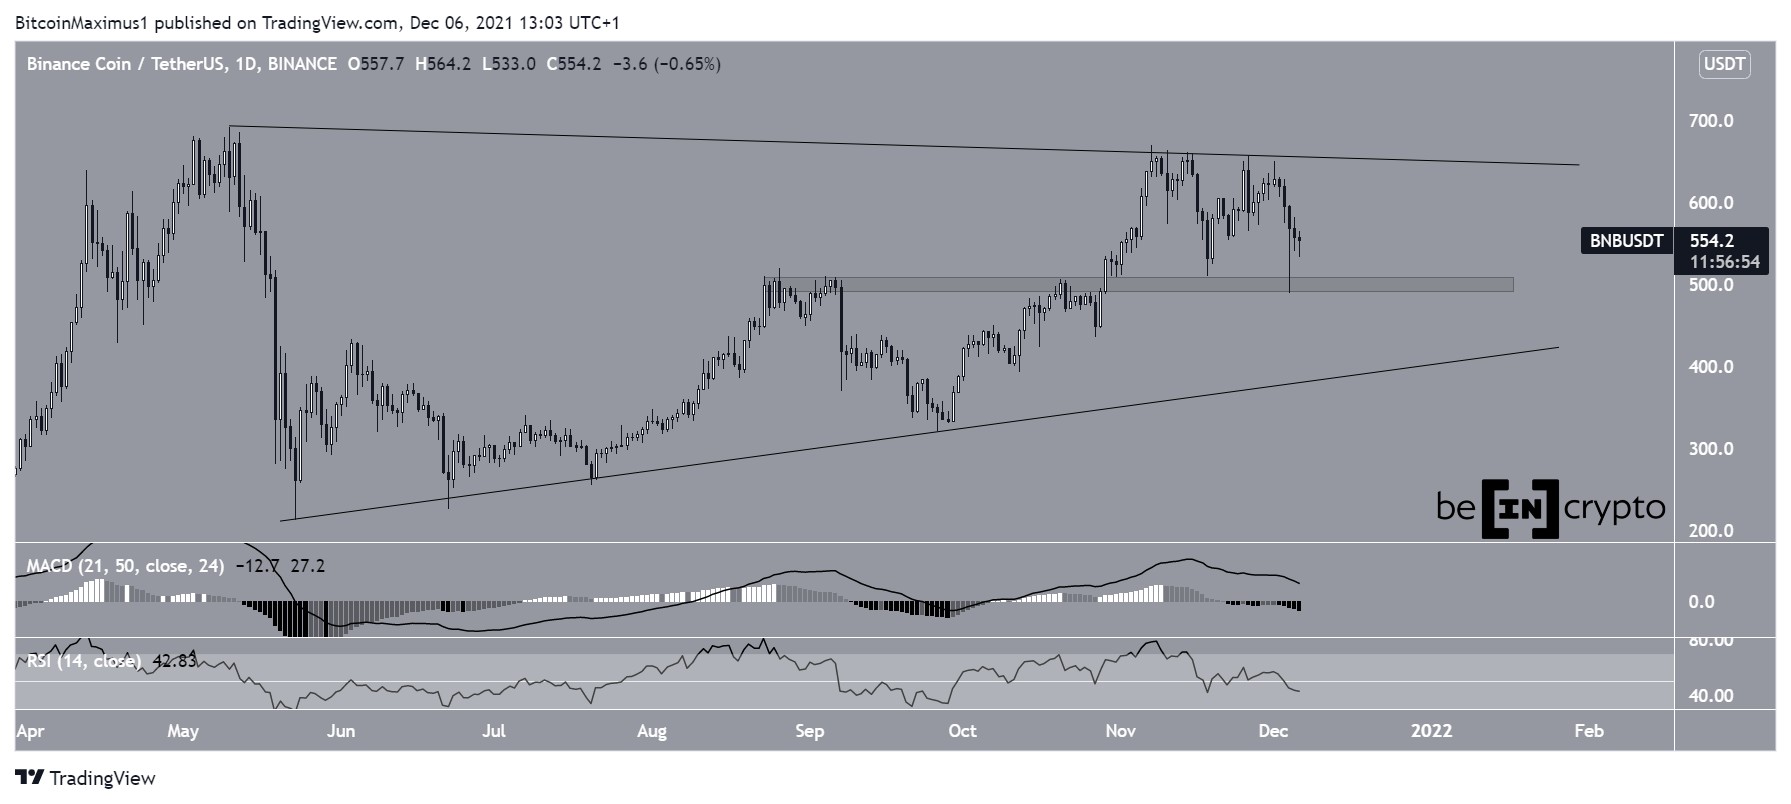
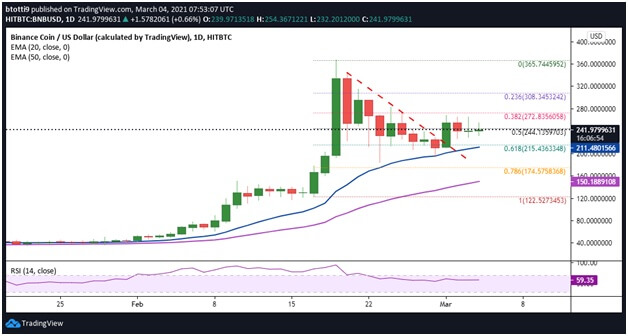
BNB has been decreasing alongside a descending resistance line, which has been in place since the May 10 all-time high of $691.8.
More recently, the line rejected BNB thrice, on Nov 7, 14 and 26 respectively (red icons). Afterwards, it proceeded to reach a low of $489 on Dec 4.
However, the token bounced and created a long lower wick, which is considered a sign of buying pressure. Furthermore, the bounce served to validate the $510 area as support. The area previously acted as resistance during Sept, and has turned to support after the Oct breakout.
However, while the price action could still be seen as bullish. Technical indicators are bearish.
The MACD, which is created by a short- and long-term moving average, is decreasing and is nearly negative. This means that the short-term MA is losing ground relative to the long-term one.
The RSI, which is a momentum indicator, is below 50. Movements above this line are considered bullish, while those below it are bearish.
Therefore, the daily chart provides mixed signs.
Chart By TradingView Current channelThe shorter-term six-hour chart is more bullish, since it shows that BNB is trading inside a descending parallel channel. These patterns usually contain corrective movements, which means that an eventual breakout is likely.
However, BNB is trading in the lower portion of the channel. In order for the breakout possibility to become more likely, BNB has to reclaim the middle of the channel and validate it as support.
Also, similarly to the daily time-frame, both the RSI and MACD are bearish and decreasing.
Chart By TradingView Future BNB movementCryptocurrency trader @CryptoTony_ outlined a BNB chart, stating that the token has begun a new bullish impulse, which would take the token towards new highs.
Source: TwitterIn order for the count to be correct, BNB has to hold on above the $489 low of Dec 4 (red line).
While the ensuing upward movement (highlighted) does not clearly look like a bullish impulse, what makes this count likely is the fact that both preceding decreases (highlighted in lack) have an exactly 1:1 ratio. This is common in such corrective structures and suggests the correction is done.
Chart By TradingViewTherefore, in order for this possibility to remain valid, BNB has to create a higher low inside the $516-$538 support, which is created by the 0.618 – 0.786 Fib retracement support levels.
Chart By TradingViewFor BeInCrypto’s latest Bitcoin (BTC) analysis, click here.
The post Binance Coin (BNB) Holds Firm Above $500, Could See New Highs appeared first on BeInCrypto.
origin »Bitcoin price in Telegram @btc_price_every_hour
Binance Coin (BNB) на Currencies.ru
|
|