2021-10-16 18:19 |
BeInCrypto takes a look at the seven altcoins that decreased the most over the past seven days, from Oct 8 to Oct 15.
These altcoins are:
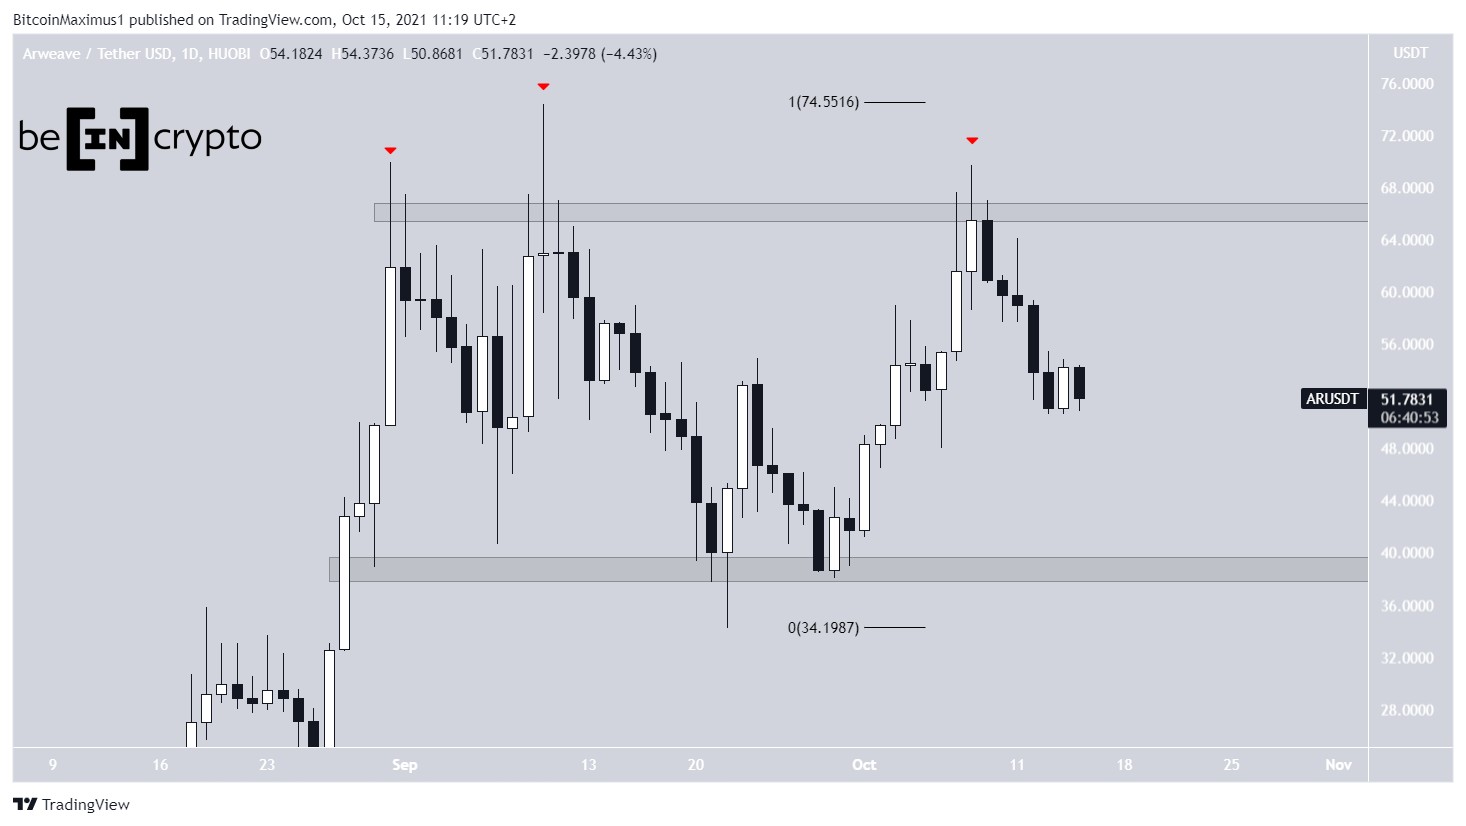
Arweave (AR) : -25.35% Terra (LUNA) : -23.54% Internet Computer (ICP) : -19.58% Fantom (FTM) : -14.50% Avalanche (AVAX) : -13.71% Quant (QNT) : -13.19% Theta Token (THETA) : -12.24% ARSince Aug 31, AR has made three attempts at moving above the $66 resistance area. However, all three have been unsuccessful (red icons).
The most recent one was on Oct 8. Since failing to break out, AR has been moving downwards.
The three rejections have created what is known as a triple top. This is a bearish pattern that often leads to trend reversals.
The closest support area is at $39.
Chart By TradingView LUNAOn Oct 12, LUNA broke out from a descending resistance line (green icon), indicating that the previous downward movement had come to an end. This led to a new all-time high price of $49.54 on Oct 4.
However, the upward movement could not be sustained, and the token has been moving downwards since.
Currently, it is attempting to validate the aforementioned resistance line as support. The line also coincides with the 0.5 Fib retracement support level.
If successful in doing so, LUNA would be expected to move towards a new high. However, there are no signs that would suggest a bullish reversal will occur.
A decrease below this resistance line would mean that the upward movement has come to an end.
Chart By TradingView ICPICP had been increasing inside an ascending wedge since June 29. However, the ascending wedge is considered a bearish pattern, meaning that the price is expected to break down in the majority of cases.
On Sept 6, ICP reached a high of $86 (red icon), but decreased after it was rejected by the resistance line of the wedge. The next day, it broke down from the pattern, confirming that the upward movement had come to an end.
Currently, ICP is trading above support at $40, touching the area for the second time.
Since the area previously acted as resistance, it is now expected to act as support and initiate a bounce. Despite this, there are no bullish reversal signs currently in place.
Chart By TradingView FTMFTM has been moving downwards since it reached an all-time high price of $2.45 on Oct 8. The downward movement has so far led to a low of $1.90, doing so on Oct 13.
However, the decrease has also taken the shape of a descending parallel channel. Such channels usually contain corrective movements. This means that the dominant trend is upward while the downward movement is just a correction in response to the prior increase.
Finally, the RSI has generated bullish divergence. The RSI is a momentum indicator, and the divergence is a sign that the price decrease was not accompanied by a decrease in momentum.
Therefore, a bounce and breakout would be the most likely scenario.
Chart By TradingView AVAXAVAX has been decreasing since Sept 23, when it reached an all-time high price of $79.80.
Currently, it is trading just below the $57 area. The area holds considerable importance, since it previously acted as the all-time high resistance. However, while it was expected to act as support (green icon), AVAX broke right below it.
In addition to this, the RSI has fallen below 50. The RSI is a momentum indicator, and the cross below the 50 line often means that the trend is bearish. Previously, the cross above 50 (green icon) that transpired on July 26 preceded the entire upward movement.
Therefore, it is possible that AVAX will continue moving downwards.
Chart By TradingView QNTQNT has been moving downwards since Sept 11, when it reached an all-time high price of $429.69.
On Sept 20, it initiated a bounce, possibly putting an end to the ongoing downward movement.
However, the token has been trading inside a symmetrical triangle since. While the triangle is considered a neutral pattern, it usually acts as a continuation pattern. This means that after it is complete, the preceding trend continues.
In the case of QNT, the trend is bearish, since the token has been moving downwards over the past month.
If a breakdown occurs, the closest support would be at $185.
Chart By TradingView THETATHETA has been moving upwards since breaking out from a descending wedge on Sept 30 (green icon). This indicated that the previous downward movement had come to an end.
However, THETA failed to reclaim the $6.90 area and was rejected twice, on Oct 6 and 9. This movement solidified the $6.90 area as resistance.
After the rejection, THETA found support above the 0.618 Fib retracement support level at $5.55 and is in the process of moving towards the $6.90 area once more.
If it is successful in doing so, it would likely increase towards the Sept highs at $9.60.
Chart By TradingViewFor BeInCrypto’s latest Bitcoin (BTC) analysis, click here.
What do you think about this subject? Write to us and tell us!
The post Biggest Weekly Losers: Will Avalanche (AVAX) Hold on Above Previous All-Time High? appeared first on BeInCrypto.
origin »Bitcoin price in Telegram @btc_price_every_hour
High Voltage (HVCO) на Currencies.ru
|
|