2019-9-9 23:30 |
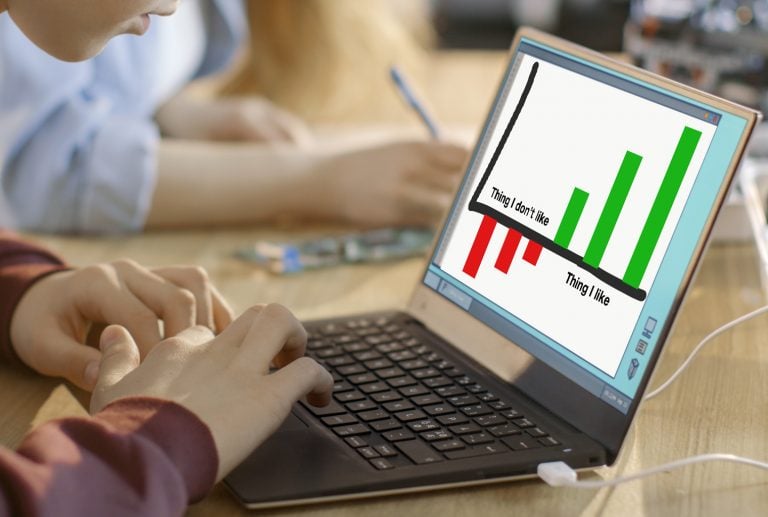
On Friday, crypto analytics site Messari and data analyst Zack Voell shared a controversial chart called “Bitcoin Cash versus Lightning,” which claims to display a comparison of activity for both networks. Voell contended that the Lightning Network was growing at a faster rate than the scaling solution BCH has to offer. The way the chart was portrayed and the written critique was contentious, to say the least, and crypto supporters accused the Messari analyst of being biased and “cherry picking” data.
Also Read: Bitcoin’s Early Days: How Crypto’s Past Is Much Different Than the Present
Messari Analyst Accused of Cherry Picking DataZack Voell, a data analyst from Messari, stands accused of producing biased material for the website that claims to “promote transparency and smarter decision-making in the cryptoasset community.” On Sep. 6, Voell tweeted a chart that claimed to show the comparative growth and use of BCH versus the Lightning Network. A quick glimpse at the chart shared by Voell makes it look like the Lightning Network has seen exponential growth while the BCH side is dreary. According to the author, “[BCH] transaction count, traded volume, returns (denominated in Bitcoin), and active addresses all fell by double-digit percentages since September 2018.”
Bitcoin Cash versus Lightning
YTD of comparative network activity seems to show one scaling solution growing significantly faster than the other. (Obviously, the comparison is imperfect, but these data are still telling.) https://t.co/Uvf5z2WoBW pic.twitter.com/qzjFdYkPSC
— Peter Ryan (@_PeterRyan) September 7, 2019
Following Voell’s tweet, live stream host Collin Enstad laughed at the Messari analyst’s chart and asked: “Did you just cherry pick a stress test day from a year ago and then claim the transaction count is down over 90% — 12 months later?” During the first week of September 2018, BCH participants had multiple stress tests and the network saw millions of transactions per day on a few occasions that week. In fact, many BCH supporters believe the September stress tests proved that Bitcoin can scale, when miners processed 2.4 million transactions in one day and fees remained at $0.003-0.001 per transaction.
In response to Voell’s tweet and chart, the researcher from Ryan Research, Peter Ryan, asked the Messari analyst why he didn’t use year-to-date (YTD). Ryan further explained that looking at the comparative growth and use of Bitcoin Cash versus Lightning is better with YTD metrics. “YTD of comparative network activity seems to show one scaling solution growing significantly faster than the other. (Obviously, the comparison is imperfect, but these data are still telling),” Ryan’s tweet said. Following the discussion on Twitter, news.Bitcoin.com spoke with Peter Ryan about Voell’s assessment of both networks.
A Discussion With Researcher Peter RyanNews.Bitcoin.com (BC): What do you think about the recent chart Zack Voell from Messari shared yesterday?
Peter Ryan (PR): While it appeared to use valid data, the comparison was dubious in a few ways.
One, BCH and the Lightning Network (LN) are two different technologies with different metrics. This is a classic apples to oranges fallacy. For instance, there’s no way to measure the transaction count on the LN and no equivalent of “node capacity” on BCH.
Two, the choice of data was biased. It showed 12 months back to a stress test on the BCH network which could distort how one could view growth. This is why most analysis comes out quarterly or monthly because it provides an objective choice of dates rather than one that is arbitrary.
Peter Ryan, founder of Ryan Research.BC: Why do you think someone from a startup that’s supposed to share unbiased data concerning crypto networks and markets would share something like that?
I’m sure he would paint it as “just reporting the data,” but this is obviously a low-brow attempt to justify the fragile scaling narrative around the Lightning Network.
BC: Do you think the chart and report reflected poorly on Messari?
PR: Yes. It’s a shame that their tools for better data analysis get overshadowed by their team’s repeated demonstrations of bias. It’s possible that this bias could taint their quantitative reporting, although that hopefully seems unlikely. I’m more concerned about them leveraging the brand of an objective data provider to perform distorted punditry.
BC: You recently shared a chart of your own from Ryan Research can you tell us about the data stemming from this?
PR: It was more a lark than a chart. I was displeased with the sleight of hand by Zack, so I duplicated the exact same chart as his but changed only one parameter: the date.
My chart compared YTD instead of his 12-month version and showed a different picture. Bitcoin Cash actually performed better than Lightning. For instance, BCH’s transactions grew 691% compared to much lower growth figures from Lightning.
BC: Can you tell our readers a little about Ryan Research and how you got into researching cryptocurrency data?
PR: Ryan Research is a firm focused on analyzing complex subjects and communicating clear explanations.
Whether through data, like showing an objective analysis of supply forecasts on different bitcoins, or through more qualitative content, like a survey of thought leader commentaries from across the crypto industry.
I have a degree in economics from New York University and have worked as an analyst in various venture capital and startup contexts. More recently, I was the lead research analyst at Coindesk and assisted them in enhancing their cryptocurrency data research.
ryanresearch.coBC: If you were to compare BCH scaling data versus Lightning Network scaling data how do you see the two competing?
PR: It’s very difficult to make comparisons between the two, let alone any unique cryptocurrency. If I were to suggest a somewhat sufficient one, it might be Lightning Network Nodes vs. Bitcoin Cash Active Addresses as they are both used as rough proxies for users. As of today, BCH has about 40,000 active addresses compared to about 5,000 nodes on Lightning.
BC: Where do you recommend cryptocurrency enthusiasts find unbiased cryptocurrency network and market data?
PR: I recommend Coinmetrics, Coingecko, Cryptocompare, Bitinfocharts, Coin Dance, and of course charts.Bitcoin.com. Always try to get to the raw numbers and avoid any “adjusted” or fancy metrics derived from biased calculations. However, you could avoid all that bean-counting agony and read Ryan Research, where we do it all for you.
What do you think about the chart shared by the Messari analyst? What do you think about Peter Ryan’s opinion? Let us know what you think about this subject in the comments section below.
Image credits: Shutterstock, Feature Image on computer by @karbonbased, Ryan Research, and Twitter.
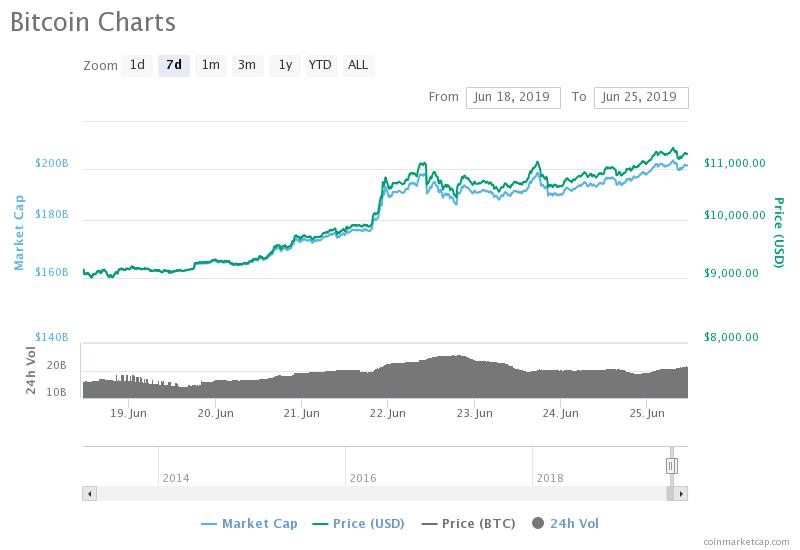
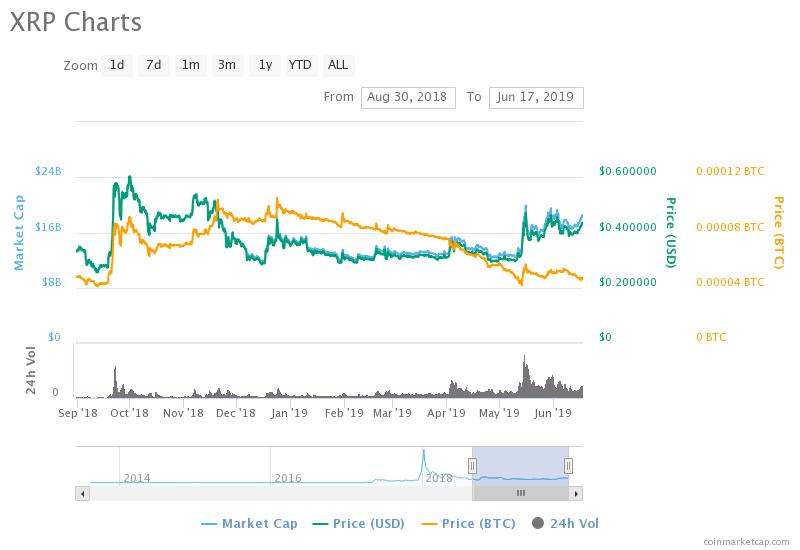
Do you want to dig deeper into Bitcoin? Explore past and present cryptocurrency prices through our Bitcoin Markets tool and head to our Blockchain Explorer to view specific transactions, addresses, and blocks.
The post ‘Avoid Biased Calculations’ Says Crypto Researcher After Cherry-Picked Chart Debate appeared first on Bitcoin News.
origin »Bitcoin price in Telegram @btc_price_every_hour
Emerald Crypto (EMD) на Currencies.ru
|
|