2024-4-2 12:30 |
The Avalanche (AVAX) price is at a pivotal point, as current indicators offer bearish signals. Its 7-day Relative Strength Index (RSI) sits in neutral territory, suggesting AVAX might be on the verge of consolidation or correction. Adding complexity, the AVAX Stop and Reverse (SAR) metric has shifted from bullish to bearish, hinting at potential downward momentum.
Moreover, the formation of a death cross among the Exponential Moving Average (EMA) lines signals a stronger correction could be imminent. These indicators combined paint a picture of uncertainty and possible volatility for the AVAX price in the near term.
RSI Has Been Dropping HeavilyOver the last month, AVAX’s 7-day RSI has consistently fallen, signaling a shift in market sentiment.
On March 13, the RSI was at 74, showing strong buyer interest. But it dropped from 61 to 55 between March 27 and 28 and stayed there. This indicates a cooling of investor excitement.
AVAX RSI 7D. Source: Santiment.The RSI measures the speed and size of price changes. It ranges from 0 to 100. It shows if a cryptocurrency might be overbought (RSI over 70) or oversold (RSI under 30). AVAX’s RSI is close to, but not in, the overbought zone. This suggests a cooling interest from the high levels seen before.
The RSI’s drop hints at less interest in buying AVAX. This could lead to price stagnation or corrections. Although not in the overbought area, the RSI’s nearness to it and its downward path suggest a weakening enthusiasm for AVAX.
Read More: Avalanche (AVAX) Price Prediction 2024/2025/2030
AVAX SAR Just Changed Its StatusBetween March 31 and April 1, AVAX experienced a significant shift as its Stop and Reverse (SAR) metric transitioned from bullish to bearish. The SAR metric is a technical analysis tool designed to identify potential reversals in the market’s direction.
It functions by placing dots on a chart relative to price candlesticks; a move from below to above the price signals a shift to a bearish outlook, whereas dots moving from above to below indicate bullish momentum.
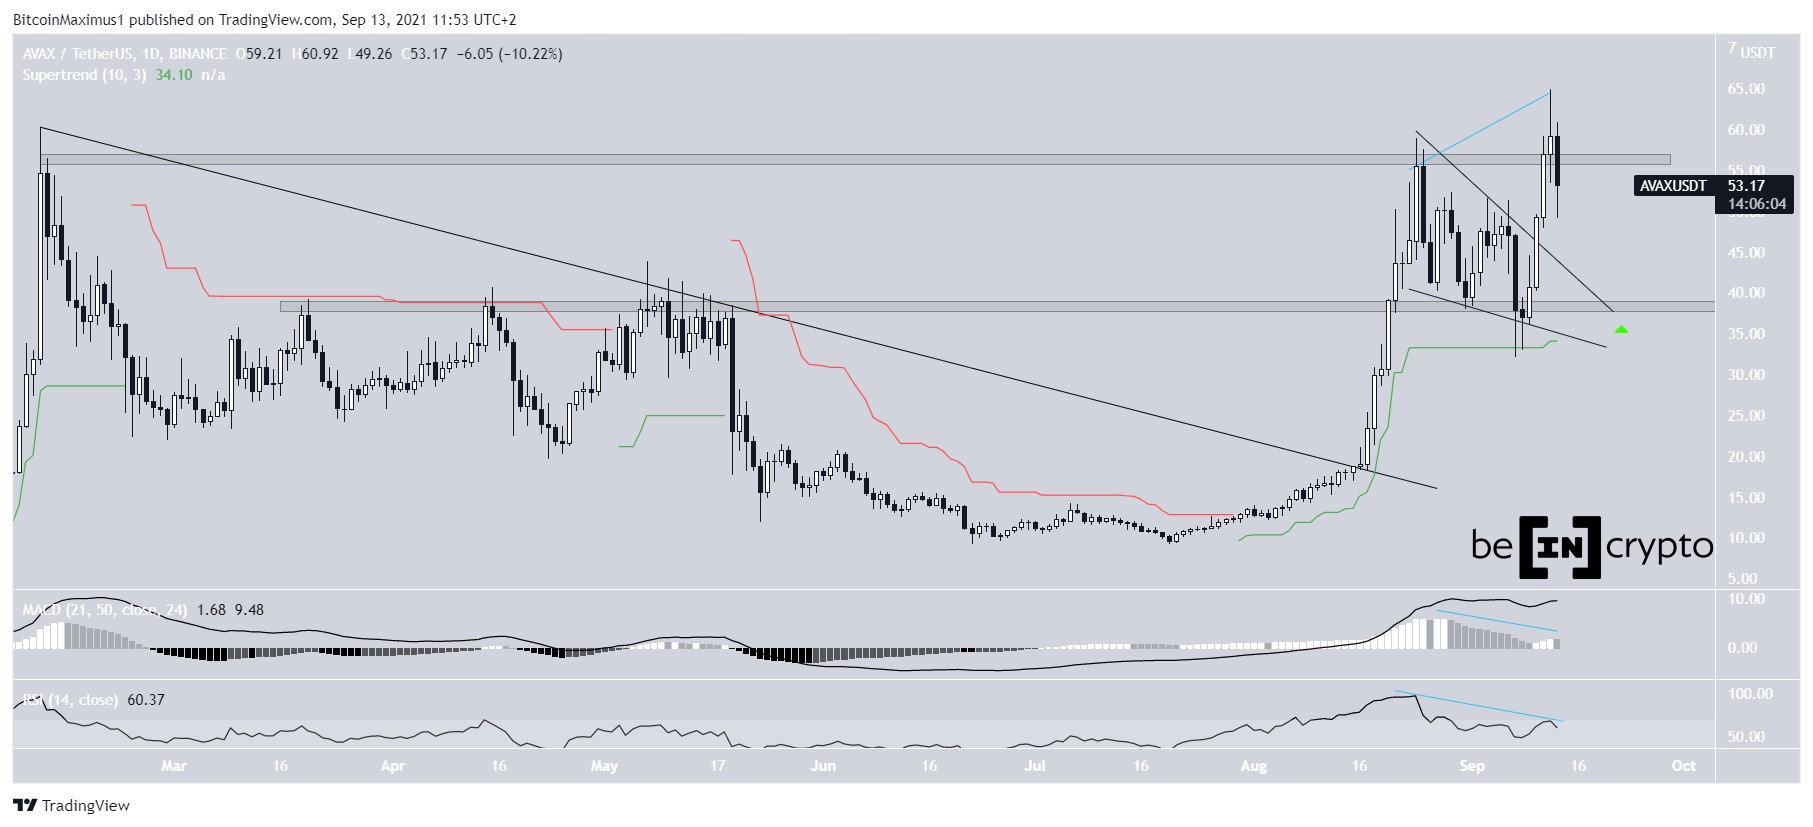
In the last instance, when the SAR indicator flipped from bullish to bearish, AVAX witnessed a sharp decline in its value, dropping from $59 to $52 in four days. This historical precedent shows the importance of monitoring the SAR metric closely for AVAX traders and investors.
AVAX 4H Price Chart, EMA Lines, and SAR. Source: TradingView.Currently, with the SAR dots positioned above the price candlesticks, this placement is interpreted as a bearish signal for AVAX’s price trajectory. Such positioning suggests a potential downtrend or a period of negative price action ahead.
Understanding this pattern is crucial for those involved in the AVAX market, as it can provide early warnings of a shift in sentiment. Consequently, the bearish signal indicated by the SAR metric’s current stance offers valuable insight for anticipating possible downward movements in AVAX’s price.
AVAX Price Prediction: Is $40 Back on the Table?Recently, AVAX’s Exponential Moving Average (EMA) lines have formed a pattern known as a death cross. A death cross occurs when a shorter-term EMA crosses below a longer-term EMA. This event is widely regarded as a bearish signal in the market, often indicating the potential for a significant downtrend.
EMA lines are a moving average that places a greater emphasis on the most recent price data, making them more responsive to new information compared to simple moving averages (SMAs). This responsiveness makes the EMA a crucial tool for traders seeking to identify the direction of market trends.
AVAX 4H Price Chart, EMA Lines, and SAR. Source: TradingView.Given this recent formation of a death cross in AVAX’s chart, it could be a precursor to continued bearish momentum, possibly driving its price down to $40 in the near term. This indicator is particularly noteworthy for those monitoring AVAX’s price movements, as it suggests an increased likelihood of a downward trend.
Read More: How to Add Avalanche to MetaMask: A Step-by-Step Guide
However, should the market sentiment shift and an uptrend commence, AVAX has the potential to rebound, testing resistance levels at $59 and possibly extending gains to reach $65. This dynamic shows the importance of closely watching these EMA trends and their implications for AVAX’s future price direction.
The post Avalanche (AVAX) Price Outlook: Metrics Indicate Potential Correction Ahead appeared first on BeInCrypto.
origin »Bitcoin price in Telegram @btc_price_every_hour
ETH/LINK Price Action Candlestick Set (LINKETHPA) на Currencies.ru
|
|