2018-10-1 23:00 |
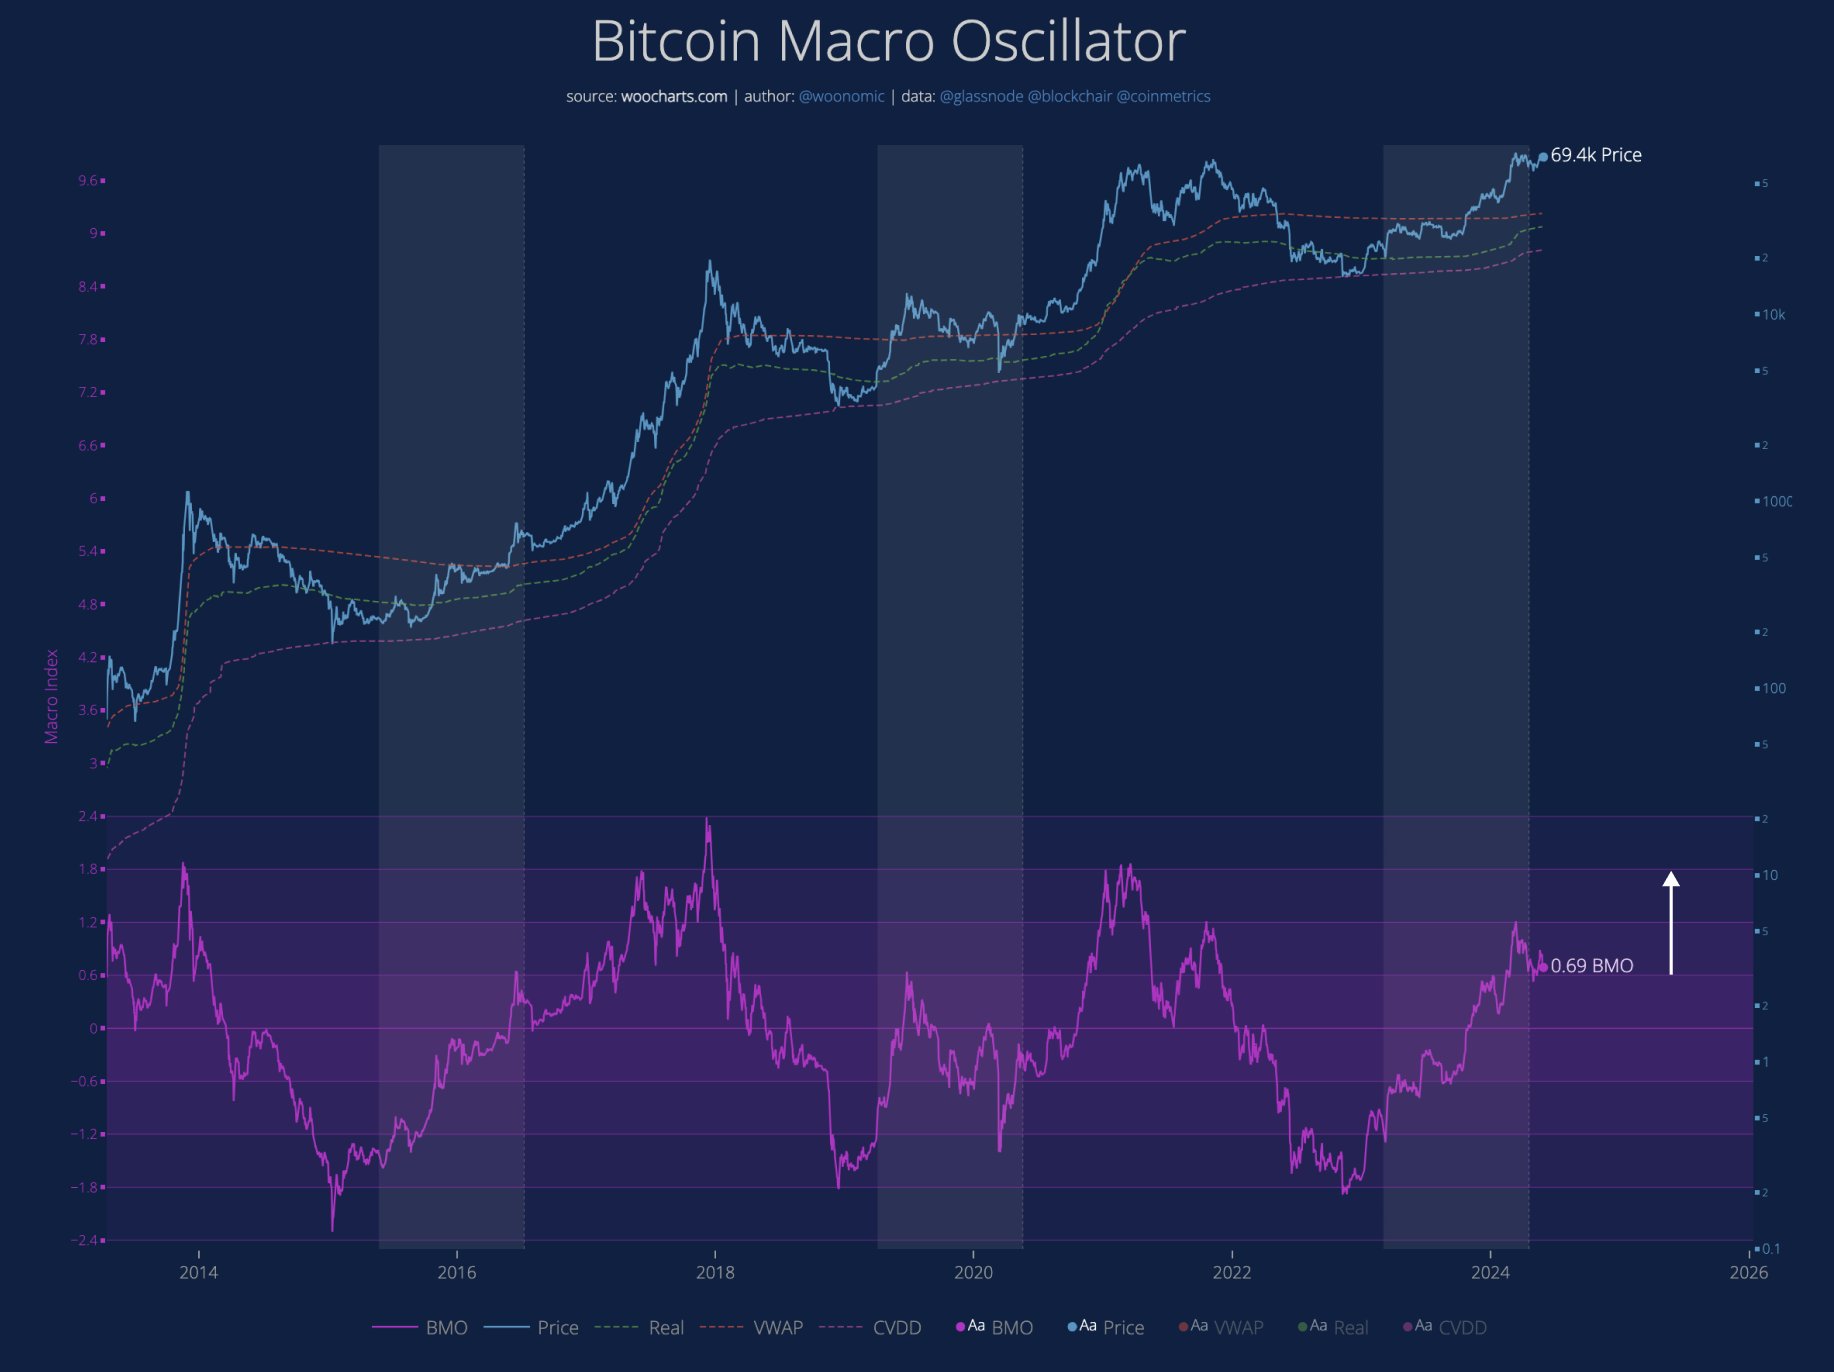
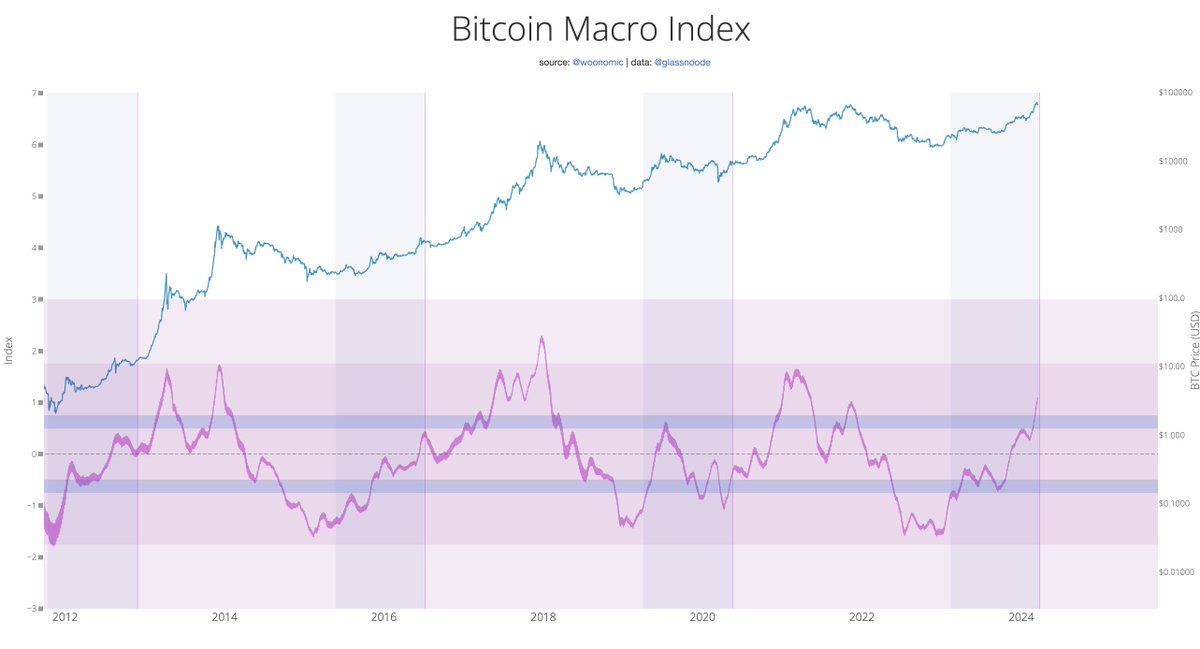
Prominent Bitcoin and cryptocurrency analyst Willy Woo recently shared a logarithmic price chart of Bitcoin created by technical analyst known as Awe and Wonder that suggests the dominant cryptocurrency is on track towards gradual recovery.
The chart, which dates back to 2010, evaluates the logarithmic regression of Bitcoin, covering three 80 percent corrections the asset experienced in the past eight years.
“Estimated BTC bottom via Logarithmic Regression analysis (below) to compliment Willy Woo’s own analysis, asserting that “$4,400 is the next real line of defense,” Awe and Wonder explained, adding, “the default assumption, takes on the meaning that nothing has changed and that this time is in fact no different. For this model, the default assumption is that the market will bottom at an equivalent deviation from the log trend line as it has in the past.
$4,400 Support Level Doesn’t Mean Bitcoin Will Test itThe price trend of an asset or currency is unpredictable and cannot be accurately demonstrated by a single technical chart. It is not possible to create one equation to satisfy all of the variables involved that affect the market and the psychology of investors in it.
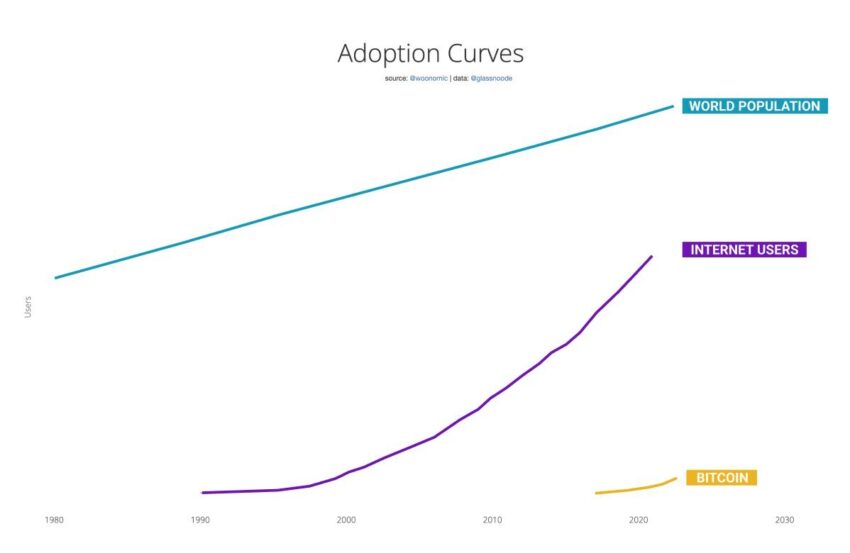
But, the logarithmic chart of Awe and Wonder considers the adoption curve of Bitcoin as the main component of the asset’s growth rate, which increases the likelihood of the arc reflecting the long-term price trend of Bitcoin.
More importantly, the chart has taken the price movement of the digital asset since 2010, back when there was very little market activity, to properly demonstrate the growth curve of the cryptocurrency over the past nine years.
Woo explained that the speculative nature of Bitcoin makes predictions on the asset significantly more difficult but rates of adoptions are easier to predict. Since the logarithmic chart acknowledges the adoption rate as its main component, it is possible that the chart can accurately portray the trend of the asset in the years to come.
As Bitcoin undergoes its adoption S-curve it scribes a "Falcon-9 rocket trajectory" on the long range chart. If we measure the deviation from this arc, it provides clues into where we are in the price cycle. [Chart by @Awe_andWonder] pic.twitter.com/YQF2Oiocf9
— Willy Woo (@woonomic) September 29, 2018
The analyst emphasized that it is crucial to understand the complexity of the speculative game and that no chart can exactly lay out the long-term price trend of an asset in the cryptocurrency market.
He added:
“In this case, BTC is not your typical stock price. It’s a speculative traders game riding on top of an adoption curve. The speculative game is complex, but rates of adoptions are more predictable. In my opinion, the chart runs on this thesis, mapping the deviation of between two.”
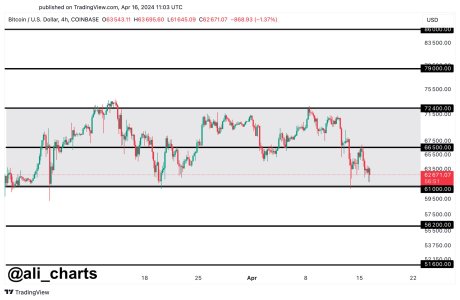
The chart has outlined $4,400 as the base support level of Bitcoin by early 2019. But, the range of the chart places the likely target price of Bitcoin in January of 2019 to be in the range of $4,400 to $10,000.
Although the gap between the support level and the resistance level seems large, on several occasions throughout 2018, Bitcoin has increased from $6,000 to $10,000 within a 30-day period and as such, a high level of volatility for Bitcoin should be expected.
Where is Bitcoin Headed to?Many prominent investors and analysts including ShapeShift CEO Erik Voorhees, billionaire investor Mike Novogratz, and Fundstrat’s Tom Lee have said in the past that the worst part of the correction is over.
The market has started to demonstrate seller fatigue and some cryptocurrencies like XRP and Ethereum, which recorded 75 percent drops in the period of April to September, have initiated impressive corrective rallies with strong volume and momentum.
The post Analyst: Logarithmic Chart Shows Bitcoin is on Track, $50,000 by 2021 appeared first on CryptoSlate.
origin »Bitcoin price in Telegram @btc_price_every_hour
Bitcoin (BTC) на Currencies.ru
|
|