‘Altcoin Season’ Invalidation Case Made By Cryptocurrency Analyst

‘Altcoin Season’ Invalidation Case Made By Cryptocurrency Analyst
фото показано с : beincrypto.com

2019-12-5 05:23

The total altcoin market cap began an upward movement on September 24. It gradually increased until November, before breaking down. On November 25, it reached a lower low than on September 24, invalidating the upward movement.

While several altcoins have been posting double-digit increases on the daily, such as Ravencoin, which has increased by 19%, the market in its entirety has been on a downward trend since late May.

The upward movement that began on September 24 had many calling for a period in which altcoins would increase massively due to the fact that they were doing so during a Bitcoin price decrease. However, the altcoin market cap reached a lower low on Nov 25.

A similar sentiment is given by technical Analyst @LomahCrypto, who suggested that trading altcoins has not been very profitable, and will likely continue being so since the market has approached a strong resistance.

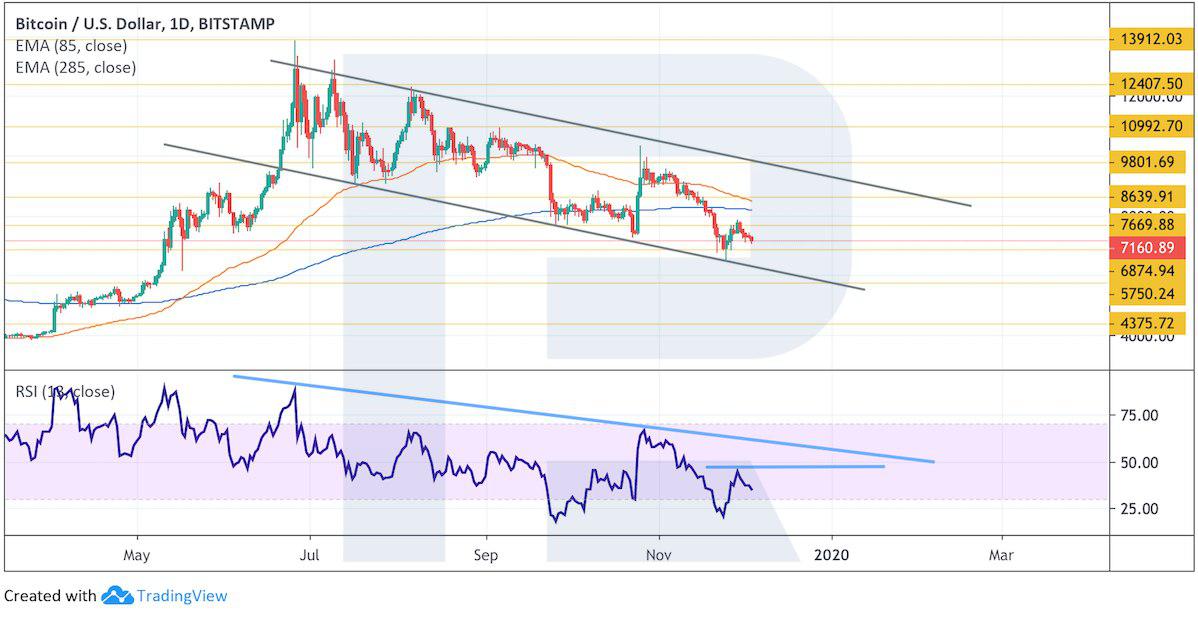
Something that I've been neglecting lately is trading ALTS with respect to how the ALTS market cap looks.

Back-testing with my journal for W/L trades I would have avoided 11W and 18L since July if I just avoid trading ALTS completely when we're at D3/W1 resistance. pic.twitter.com/FKaEu7KXNJ

— Loma (@LomahCrypto) December 3, 2019

This is in stark contrast to the sentiment of only several weeks ago, in which the majority of crypto twitter was calling for the beginning of the next ‘altseason.’ Let’s take a closer look at the price movement and see where it’s likely to head next.

Altcoin Market’s Strong Support

The altcoin market cap has created a very strong support area at $60 billion, which is reinforced by the 0.786 fib level. Inside it, the price has made a possible double bottom, which is considered a bullish reversal pattern.

Therefore, the current movement can be seen as a retracement in response to the upward move beginning in December 2018. The total market cap would have to stay above the support area and soon initiate an upward move. There is no bullish divergence to suggest that this will happen.

A closer look reveals a break down from an ascending support line. Afterward, it validated this as resistance and is currently heading downward. The price is also following a descending resistance line.

This suggests that the price will move towards the next support area at $50 billion, where it will possibly make an attempt to move higher.

Short-Term Perspective

The very short-term market movement shows a descending wedge. Additionally, there is a bullish divergence in both the RSI and the MACD.

This suggests that a breakout is likely. However, it remains to be seen whether this movement will cause the total market cap to move above the previously broken ascending support line. Due to the bearish medium-to-long-term outlook, this seems unlikely.

To conclude, the altcoin market cap has possibly broken down below a support line and validated it as resistance. Lower time-frames suggest an upward movement will occur, but it remains to be seen whether the move will invalidate the previous breakdown.

Disclaimer: This article is not trading advice and should not be construed as such. Always consult a trained financial professional before investing in cryptocurrencies, as the market is particularly volatile.

Images courtesy of Twitter, TradingView.

The post ‘Altcoin Season’ Invalidation Case Made By Cryptocurrency Analyst appeared first on BeInCrypto.

Similar to Notcoin - TapSwap on Solana Airdrops In 2024

origin »

Altcoin (ALT) на Currencies.ru

$ 0.0201971 (+0.00%)
Объем 24H $0
Изменеия 24h: 0.00 %, 7d: 0.00 %
Cегодня L: $0.0201971 - H: $0.0201971
Капитализация $2.488k Rank 99999
Доступно / Всего 123.175k ALT

movement upward september november altcoin breaking down

movement upward → Результатов: 84


Фото:

Bitcoin’s Bart Pattern Makes Another Appearance [Premium Analysis]

The Bitcoin price just completed a Bart pattern to the downside and is in the process of completing another one. The latter could take the price to $7200 or below. On December 4, the Bitcoin price initiated a rapid upward movement, which could have been caused by a massive transfer of Tether to the OKEx […] The post Bitcoin’s Bart Pattern Makes Another Appearance [Premium Analysis] appeared first on BeInCrypto.

2019-12-5 14:12


Фото:

Litecoin’s Decrease Could Spell Doom for Future Prospects, Says Investor

The Litecoin (LTC) price has been decreasing since reaching a high of $147 on June 22. However, during the past 23 days, the price has been trading in a range between $51-$59. When the price moves out of a range, the movement is often done in rapid fashion, whether that is done in an upward […] The post Litecoin’s Decrease Could Spell Doom for Future Prospects, Says Investor appeared first on BeInCrypto.

2019-10-19 14:21


Bitcoin [BTC] is ‘first bearer instrument that can be stored digitally’, says Jimmy Song

Bitcoin’s [BTC] upward market movement had riled up the cryptocurrency industry with several proponents of the space and users calling the phenomenon as Bitcoin’s second coming. This build-up in momentum was courtsey of BTC’s price hold near the $8,500 mark, with help from the cryptocurrency breaching the $9,000 mark, albeit for a little while.

2019-6-1 12:00


BITCOIN SV Price Prediction Today: Daily (BSV) Value Forecast – May 14

The bulls remained in control of both the short and medium-term outlook. Traders may consider buying at pullback area with bullish reversal candlesticks formation as entry confirmation. BSV/USD Medium-term Trend: Bullish Supply zones: $90, $100, $120 Demand zones: $50, $40, $30 BSVUSD is in a bullish trend in its medium-term outlook. The upward price movement […]

2019-5-14 12:37


Bitcoin [BTC] and Litecoin [LTC] Price Analysis: BTC price breakout anticipated while LTC exhibits bullishness

The cryptocurrency market went on a big sprint, with the market cap climbing all the way to $191 billion, prompted by Bitcoin’s rally beyond $6,000. As BTC continued to outperform the altcoins, its silver counterpart, Litecoin [LTC] failed to gain significant upward movement in its valuation and was trading below $80.

2019-5-11 01:30


Фото:

Ethereum forming bullish technical indicators

After a 2x upward movement in price, Ethereum (ETH), the world’s biggest smart-contract blockchain, has formed its first bullish golden cross since Feb. 19, 2017. Understanding the Moving Averages Prior to diving into a price analysis of the second largest cryptocurrency in terms of market cap, some of the technical terms used in this study […] The post Ethereum forming bullish technical indicators appeared first on CryptoSlate.

2019-4-25 03:11


Фото:

Bitcoin Price Analysis: Could Three Times Be the Charm for This Resistance Level?

Bitcoin remains in its tightly coiled range as the market continues its sideways trend for the third week in a row. While macro support has been tested three times recently, we have yet to test the overhanging macro resistance:Figure 1: BTC-USD, Daily Candles, Narrow RangeThe blue zone outlined above shows a very strong zone of support that, over the last few weeks, has seen three strong tests and has led to a slowly upward-drifting market consolidation.

2019-3-16 01:56


Фото:

Bitcoin Price Analysis: Consolidation Breaks Out Into Macro Resistance Test

Over the course of the last 10 days, bitcoin has managed to rally nearly 20% in value as it burst through two major resistance levels and is now beginning the test of a major macro level:Figure 1: BTC-USD, Daily Candles, Macro ResistanceWe can see a clear, descending supply-and-demand channel that governed the market for the last two months.

2019-2-20 01:38