2020-11-14 12:34 |
The Cardano (ADA) price has been increasing since Sept 24 and has reached an important resistance line, which has been in place since the July highs.
While a short-term breakout above the current resistance line appears likely, the longer-term trend still looks bearish.
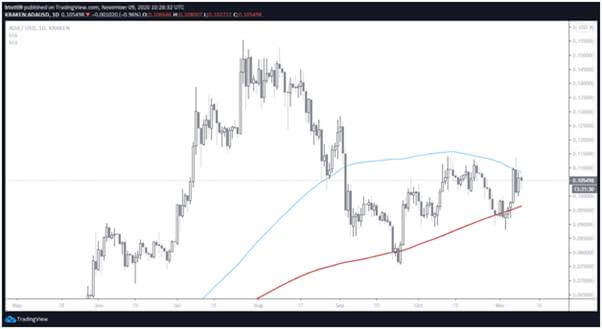
ADA Reaches ResistanceThe ADA price has been following a descending resistance line since it reached a high of $0.154 on July 26. The decline since the high has been swift, culminating in a low of $0.075 on Sept 24.
Even though the price has been increasing since, it has yet to break out from the previous descending resistance line. Furthermore, the line coincides with the $0.115 resistance area, which has rejected the price twice so far and is the 0.5 Fib level of the entire downward move.
If the price breaks out, the next significant resistance area would be at $0.125.
ADA Chart By TradingView Possible BreakoutOn the daily time-frame, technical indicators are neutral/bullish. While the MACD is above 0 and the RSI is above 50, their slope is neutral, pointing to a gradual increase.
Furthermore, there is no bullish divergence, and the Stochastic oscillator has not yet made a bullish cross.
ADA Chart By TradingViewHowever, the shorter-term two-hour chart suggests that a breakout is likely.
The price is trading inside a symmetrical triangle, which is a neutral continuation pattern, and since it is coming after an upward move, a breakout is likely.
In addition, both the MACD and the RSI are increasing at a slightly faster rate, pointing to an eventual breakout. Therefore, the price should move towards the resistance areas outlined above.
ADA Chart By TradingView Wave CountCryptocurrency trader @CryptoTony_ tweeted an ADA chart, which shows one final rally towards $0.11 – 0.12 before the price breaks down.
Source: TwitterThe wave count since the previous Jul 26 high shows a possible A-B-C corrective structure (shown in black below), with the price currently trading in the B wave.
The B wave is taking place inside an A-B-C sub-wave formation (blue), in which the price is in the C and final wave. Projecting the length of sub-wave A to C gives us a target of $12.5 for the top of the movement. This aligns with both the resistance areas outlined in the first section and the short-term triangle breakout.
Afterward, the price should begin a long downward trend.
ADA Chart By TradingView ConclusionTo conclude, while the ADA price is expected to break out in the short-term and move towards the resistance areas outlined above, the longer-term trend remains bearish unless the price successfully flips the $0.125 area as support.
For BeInCrypto’s previous Bitcoin analysis, click here!
Disclaimer: Cryptocurrency trading carries a high level of risk and may not be suitable for all investors. The views expressed in this article do not reflect those of BeInCrypto
The post ADA Approaches Downtrend Line – Will It Break Out? appeared first on BeInCrypto.
origin »Bitcoin price in Telegram @btc_price_every_hour
Resistance (RES) на Currencies.ru
|
|