2020-12-29 13:27 |
0x (ZRX) has revisited and bounced off of the long-term $0.295 area, validating it as support in the process.
Despite ambiguity from technical indicators, 0x is expected to increase to the closest resistance area at $0.425 and could possibly move higher after.
0x Long-Term Support LevelsZRX has been moving downwards since it reached a high of $0.96 on Aug. 21. The decrease has been swift and ZRX reached the $0.295 support area at the beginning of November.
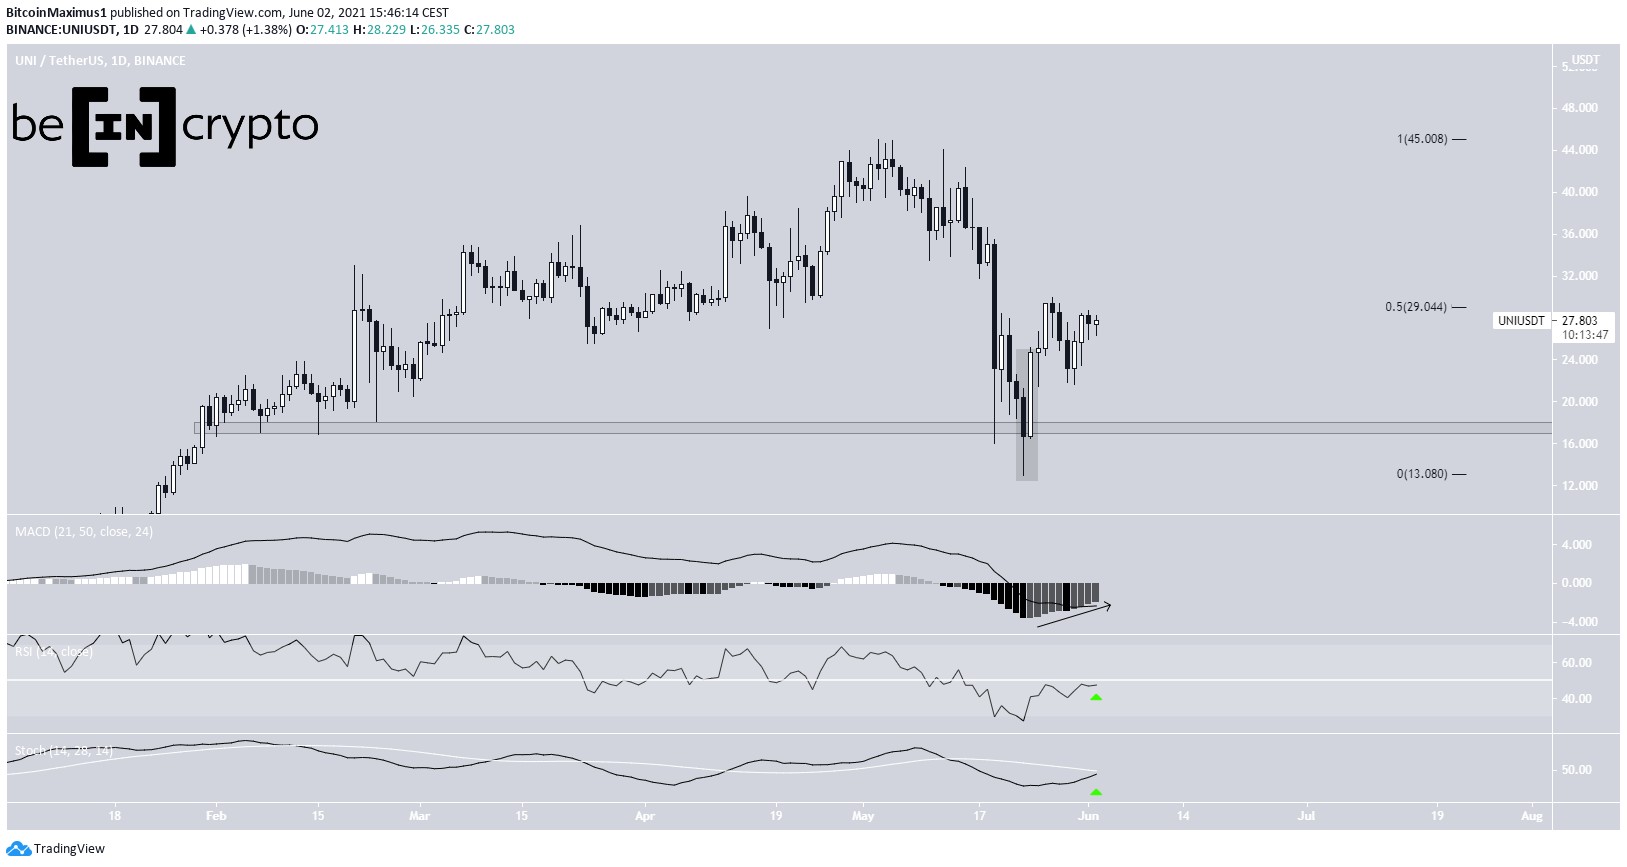
Since then, ZRX has been trading in a range between support at $0.295 and resistance at $0.425. The price is currently trading closer to the resistance than the support.
ZRX Chart By TradingViewTechnical indicators are undecided. While the Stochastic oscillator has made a bullish cross, both the MACD and RSI are bearish.
Therefore, we cannot confidently predict the trend until ZRX either breaks out above resistance or breaks down below support.
ZRX Chart By TradingView Wave CountThe wave count suggests that ZRX is in the C wave of an A-B-C corrective structure (shown in black in the image below). The most easily identifiable part of this structure is the B wave, which does look entirely corrective.
If true, the current increase could take ZRX above the $0.425 resistance area and towards the November highs at $0.55. On the other hand, a decrease below the wave 2 low of $0.31 would invalidate this particular wave count.
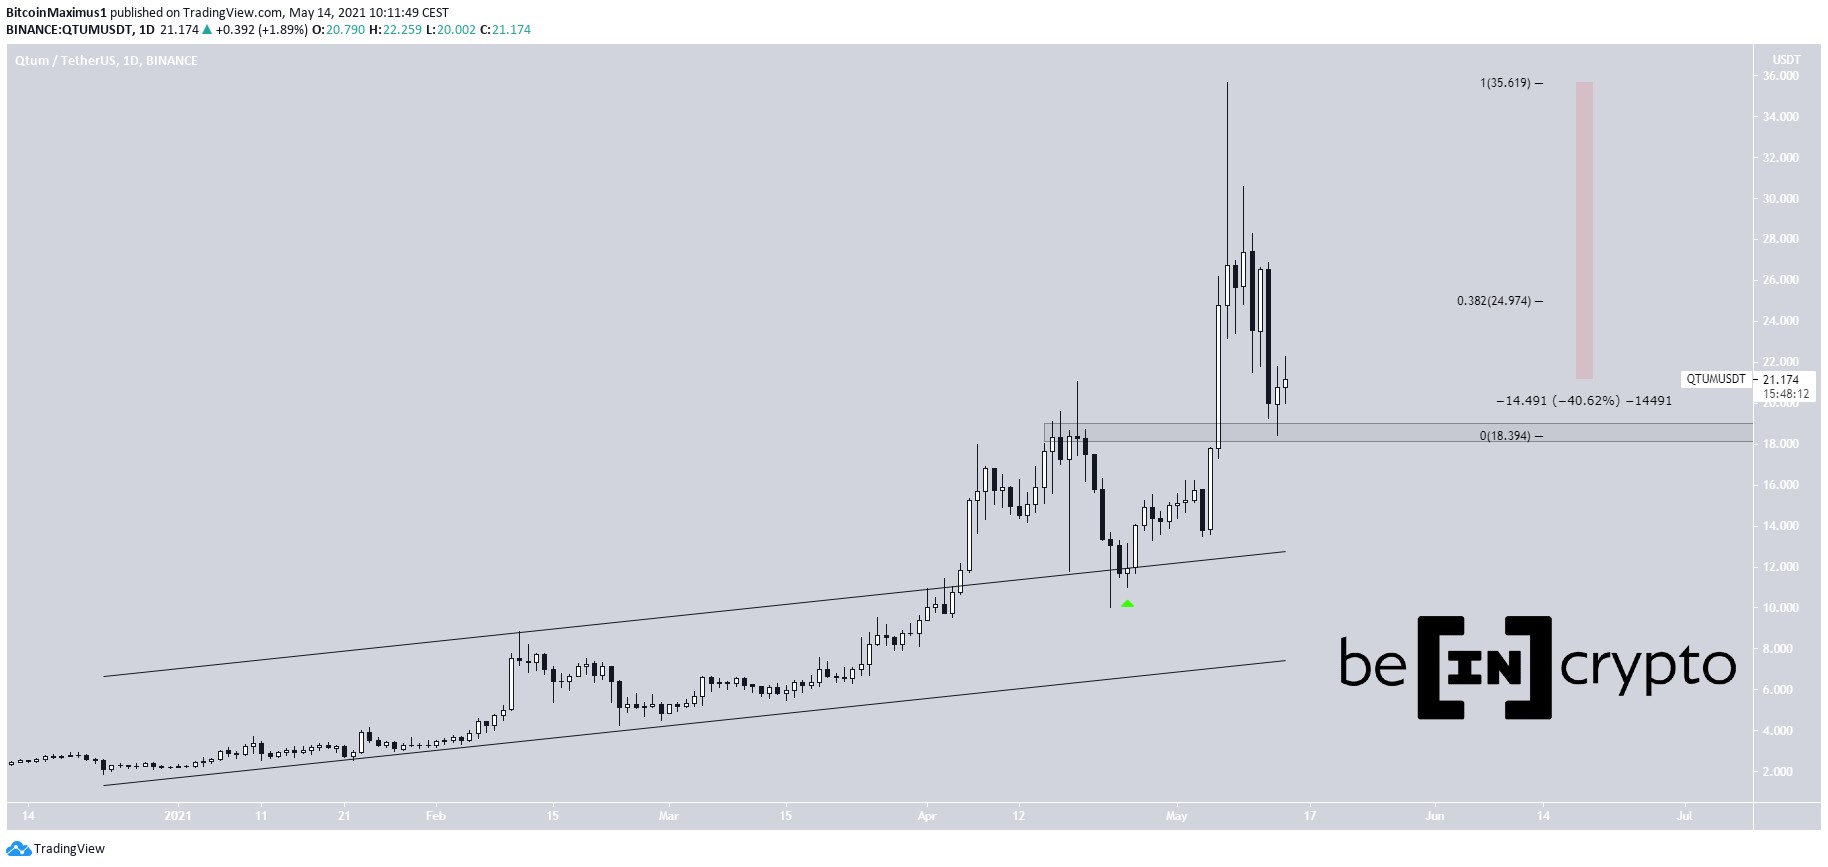
ZRX Chart By TradingViewThe two-hour chart shows that ZRX has found support between the 0.5 and 0.618 Fib retracement levels.
While the invalidation level of $0.31 is much lower, it’s crucial that the current support area holds in order for the hopes of upward continuation to remain intact.
ZRX Chart By TradingView ZRX/BTC Nearly Reaches All-Time LowCryptocurrency trader @Bitaltsguy outlined a ZRX/BTC chart, stating that if the current support area at 1,775 satoshis holds, ZRX could begin a significant upward movement.
Source: TwitterSince the tweet, the support area has actually failed, and ZRX has continued its descent. The pair is currently trading near 1,400 satoshis. The next closest support area is found at 1,100 satoshis — the all-time low level.
While ZRX seems all but certain to reach this level, technical indicators have not yet shown any bullish reversal signs, casting doubt on the possible trend reversal.
In any case, the reaction to this area will be crucial in determining if ZRX can reverse its trend.
ZRX Chart By TradingView 0x ConclusionThe ZRX/USD pair is expected to gradually increase towards resistance at $0.425 and possibly break out.
The ZRX/BTC pair is trading very close to its all-time lows but has not given any bullish reversal signs yet.
For BeInCrypto’s latest Bitcoin (BTC) analysis, click here!
Disclaimer: Cryptocurrency trading carries a high level of risk and may not be suitable for all investors. The views expressed in this article do not reflect those of BeInCrypto.
The post 0x (ZRX) Finds Relief Above Crucial Support appeared first on BeInCrypto.
origin »Bitcoin price in Telegram @btc_price_every_hour
0x (ZRX) на Currencies.ru
|
|