2020-9-29 20:00 |
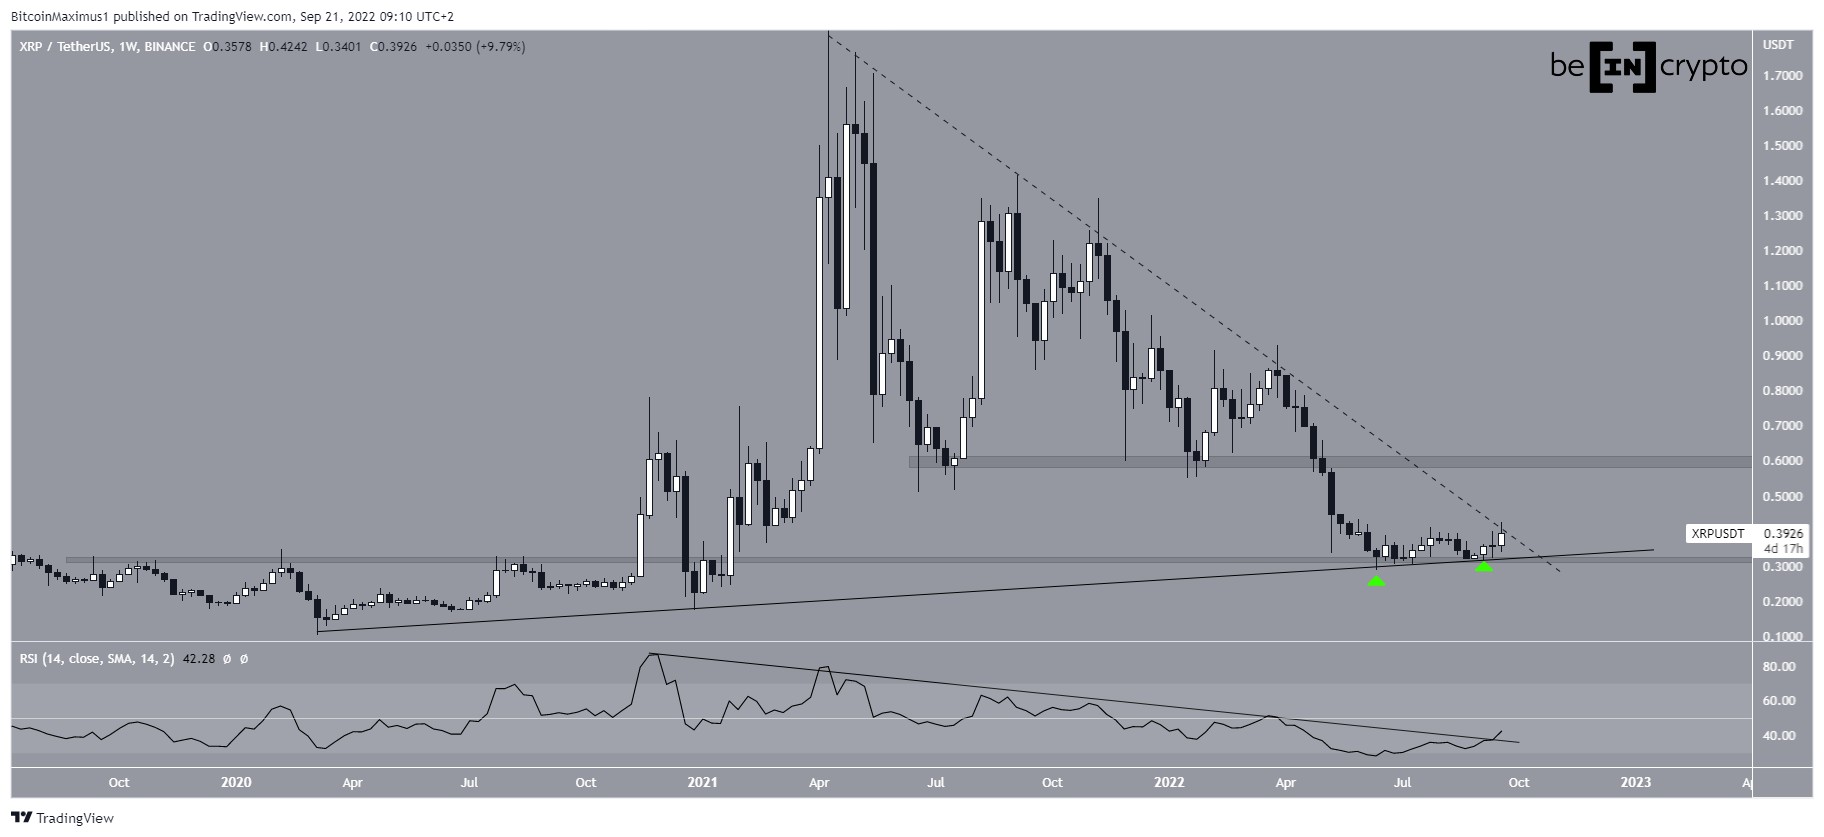
The XRP price began an upward move on Sept, 24, and reclaimed a crucial support level from which it had purportedly broken down.
This is a bullish sign that suggests that the price is likely to continue moving upwards.
Deviation Below Important Moving AverageThe XRP price has been falling since Aug 17, when it reached a high of $0.326. The decline continued until the price reached a low of $0.219 on Sept 24, but XRP bounced shortly afterward and has been increasing since.
The low was important for several reasons:
The price validated the $0.23 area as support. The price validated the ascending support line in place since the March 13 lows. The price fell below and reclaimed the 200-day moving average (MA).The latter is extremely important since deviations below/above an important support/resistance level often lead to a significant, sustained movement in the other direction.
XRP Chart By TradingViewTechnical indicators on the daily time-frame are turning bullish, but have not confirmed the upward trend yet.
The MACD has generated bullish divergence and has been rising, but has not crossed into positive territory. The Stochastic Oscillator is in the process of making a bullish cross but has yet to do so, while the RSI is below 50.
A continued price rise, ideally above $0.261 (the closest resistance area and the 0.5 Fib retracement of the previous decline) would confirm that the trend is bullish since besides reclaiming the current resistance area, it would also result in a bullish cross and an RSI move above 50.
XRP Chart By TradingView Wave CountCryptocurrency trader @davecrypto83 outlined an XRP long-term wave count, which suggests that the price can rally all the way to $0.50.
Source: TwitterIn BeInCrypto’s previous analysis, we outlined a long-term count, which shows several invalidated bearish counts.
The most likely count is that the price has now begun wave 5 (shown in black below), which should take the price all the way to $0.36.
A decline below the wave 1 high at $0.211 would invalidate this particular count.
XRP Chart By TradingViewThe rise since the Sept 24 low looks impulsive (in red below), making it likely that the price has begun an upward move. After a short-term retracement, we would expect the price to continue moving upwards.
XRP Chart By TradingViewWhile the count given in the tweet (shown below) is still valid, the only difference is the target for the top of the move, which would likely be higher.
If the price falls below $0.211 and invalidates the previous count, the one shown below will have more importance.
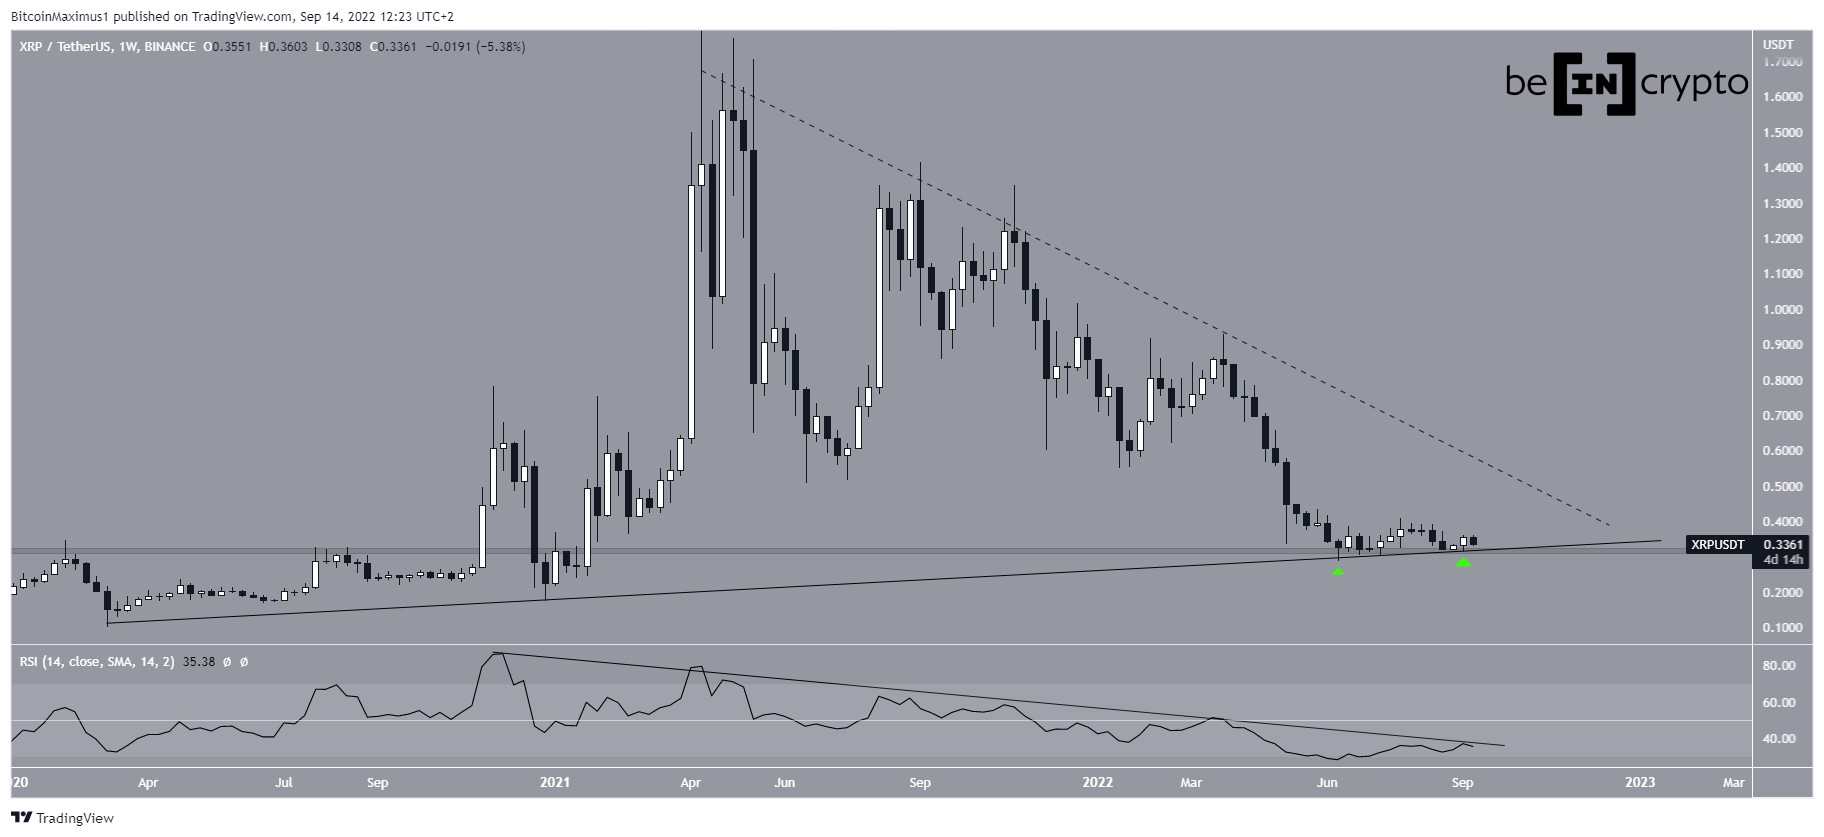
XRP Chart By TradingView XRP/BTCThe XRP/BTC pair shows a similar deviation below and subsequent reclaim of an important level. In this case, the 2200 satoshi one. In addition, the price is in the process of breaking out from a descending wedge.
A breakout from the wedge would likely take the price towards 2500 satoshis. However, technical indicators on the daily time-frame are still neutral.
XRP Chart By TradingViewThe post XRP’s Bullish Formation Remains Intact After Reclaim of Crucial Support appeared first on BeInCrypto.
origin »Bitcoin price in Telegram @btc_price_every_hour
ETH/LINK Price Action Candlestick Set (LINKETHPA) на Currencies.ru
|
|