XRP Sentiment Hits 8-Month Low as Traders Give Up — Historically a Bullish Signal

2026-6-15 11:30

XRP’s crowd mood has quietly collapsed. On June 11, Santiment’s weighted sentiment metric hit its lowest reading since October 2025, sitting at levels where the majority of social discussion is negative and volume is thinning out. The indicator combines social volume with the ratio of positive to negative commentary, making it a sharper look at what the market is actually feeling, not just what it’s saying.

Price weakness deserves part of the blame. XRP has struggled to hold attention during a period where other narratives have dominated. But there is another layer. Traders who stuck around through years of speculation about Ripple’s legal resolution and promised institutional adoption now seem exhausted. No single catalyst has landed, and the waiting has worn out the social conversation.

When Crowd Giving Up Becomes a Contrarian Signal

Santiment’s update points to a pattern that matters in crypto. Some of XRP’s strongest rallies have started when the crowd was the most disinterested. When both discussion volume and mood drop this far, the sell-side often thins out, and any fresh development or rotation can catch a market that is poorly positioned for upside. That doesn’t make a rally automatic, but it shifts the asymmetry. The last time weighted sentiment sat at these depths, XRP was approaching a notable low before a subsequent push higher.

This isn’t a guaranteed setup. Sentiment can stay negative for weeks or even months without a price reversal. What makes it notable now is the contrast with what is happening beneath the surface.

Tokenization and Ledger Usage Keep Expanding

While social media is giving up, XRP Ledger development activity, tokenization initiatives, and institutional products continue to move forward. Real-world asset tokenization has crossed $20 billion on-chain, according to a recent weekly tokenization roundup, and networks that can connect traditional finance to crypto are attracting serious capital. XRP has long pitched itself as a bridge in that space, yet the enthusiasm gap between the ledger’s quiet progress and public chatter has widened considerably.

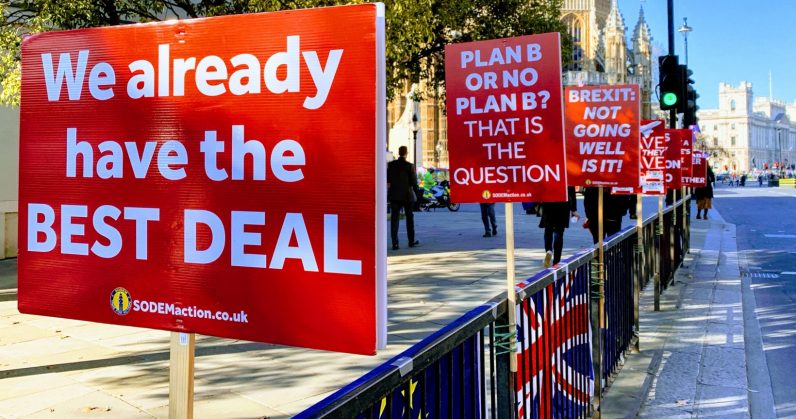
The regulatory picture remains jumbled. A major US crypto bill is hanging in the balance, with banking groups trying to reshape language just days before a Senate vote. That kind of uncertainty keeps institutional conviction contained, even while infrastructure gets built.

For traders, the question is whether this FUD floor will act like it has before. The absence of a clear catalyst doesn’t mean one won’t appear. When positioning is light and expectations are crushed, any supply-side trigger can move the price faster than most expect. But patience is still required, and the data makes no promises about timing.

origin »

Bitcoin price in Telegram @btc_price_every_hour

Ripple (XRP) на Currencies.ru

$ 1.2806 (+0.55%)
Объем 24H $2.919b
Изменеия 24h: 13.11 %, 7d: 9.13 %
Cегодня L: $1.1379 - H: $1.2863
Капитализация $79.463b Rank 5
Цена в час новости $ 1.1807 (8.46%)

low historically xrp 8-month bullish sentiment similar

low historically → Результатов: 64


Best Crypto Presale Right Now: Pepeto Is Clearly the 300x Setup Over BlockDAG and Digitap as Altseason Mentions Hit 2-Year Low

Santiment data shows social media mentions of altseason have dropped to their lowest level in two years, and historically this kind of extreme pessimism has preceded the biggest altcoin rallies of every cycle, which means the market is consolidating at the exact moment when contrarian positioning delivers the largest returns.

2026-3-7 01:00


Фото:

Bitcoin ‘Realized Volatility’ Showing Very Rare Trend: What Could Be Next

Data shows that the Bitcoin Realized Volatility metric has fallen to historically low levels. What generally happens after this pattern forms? Bitcoin Realized Volatility Has Decline To Extreme Lows Recently In a post on X, CryptoQuant author Axel Adler Jr has discussed about the latest trend taking place in the Realized Volatility of Bitcoin.

2024-6-1 01:00


Фото:

Analyst: Bitcoin Likely to See a “Monster Breakout” in the Next 3 Days

Bitcoin’s historically low volatility coupled with limited liquidity and trading volume are creating the perfect storm for it to post a massive movement Multiple technical indicators are confirming that this sideways trading is likely to end in the near-term, including the crypto’s Bollinger Bands, which are currently the tightest they have been since November of 2018 One analyst is now noting that he anticipates Bitcoin to see a “monster breakout” in the next three days […]

2020-7-21 02:00


Bitcoin’s Trading Volume is Dying Out; Setting the Stage for Explosive Volatility

Bitcoin’s extended bout of sideways trading has caused the cryptocurrency to see historically low volatility levels. In the past, bouts with volatility this low tend to be followed by massive movements that set the tone for which direction the cryptocurrency will trend in the days and weeks ahead. Analysts are noting that there are a […]

2020-7-15 19:00


Теханалитик: рынок перегрет, поэтому вряд ли биткоин вскоре достигнет $40 000

Инвестор и создатель индикатора Mayer Multiple Трейс Майер пришел к выводу, что первая криптовалюта сейчас находится в сильной перекупленности, поэтому весьма вероятна в ближайшее время ценовая коррекция.

2019-6-25 15:03


Фото:

Bitcoin Price Analysis: Slow Upward Drift Tests Market Supply

A slow, grinding upward drift has been the name of the game for bitcoin’s market over the last few weeks. The upward drift is bringing us slowly to a level that was previously rejected violently:Figure 1: BTC-USD, Daily Candles, Upward DriftOur third rejection of the red resistance level shown above brought the market into a test of macro support in the mid-$3,000s.

2019-3-23 01:23


Фото:

Bitcoin Price Analysis: Could Three Times Be the Charm for This Resistance Level?

Bitcoin remains in its tightly coiled range as the market continues its sideways trend for the third week in a row. While macro support has been tested three times recently, we have yet to test the overhanging macro resistance:Figure 1: BTC-USD, Daily Candles, Narrow RangeThe blue zone outlined above shows a very strong zone of support that, over the last few weeks, has seen three strong tests and has led to a slowly upward-drifting market consolidation.

2019-3-16 01:56