2023-8-16 03:00 |
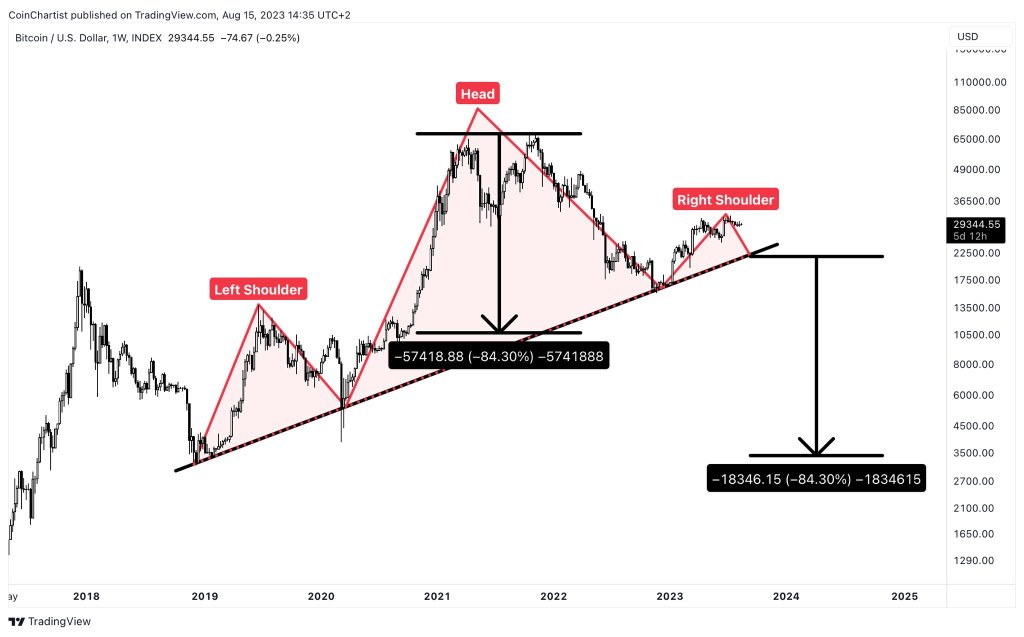
Bitcoin, the most valuable crypto asset, is at a critical juncture at spot rates if candlestick formation in the weekly chart is anything to go by. One analyst on X, formerly Twitter and NewsBTC Editorial Director Tony Spilotro, is sounding the alarm after picking out the bearish head-and-shoulder pattern in the weekly chart.
Will Bitcoin Crack?Although the pattern is technically in the last phase of formation, if realized, it could have dire implications for Bitcoin bulls as it may push prices below a multi-month critical support line toward $18,000 or lower in the weeks ahead. Even so, the volatile nature of crypto and BTC prices means traders should adopt a wait-and-see approach until it prints out.
As of August 15, Bitcoin is stable and within a broader uptrend from a top-down perspective. Notably, the coin is confined within the trading range established between June and July 2023, as visible in the daily chart.
Despite the general optimism of a price recovery above July 2023 highs, BTC was moving sideways and held above the $28,000 support level but below the $31,800 printed in the last days of H1 2023. Any breakout above $32,000 with expanding volumes might induce demand, forming an anchor for price gains toward $35,000 or better.
While the inability of sellers to drive prices lower is bullish, at least from where buyers sit, the potential formation of the head and shoulder pattern in the weekly chart casts a shadow of doubt over bullish prospects. Subsequently, traders remain cautiously optimistic since the candlestick arrangement, particularly in the weekly timeframe, suggests a vulnerability that could affect market sentiment and hopes for sustained growth.
Rate Hikes And Halving: Which Will Be A Stronger Influence?Several fundamental factors further complicate the outlook for Bitcoin’s price in the coming days. Inflation is relatively high in the United States (versus the benchmark rate of 2%), which may prompt the Federal Reserve to resume interest rate hikes in the third and fourth quarters of the year.
Despite relatively stable labor conditions and somewhat subdued inflation, the Fed’s recent rate hikes, now at the 5.25%-5.50% range, underscore the central bank’s commitment to curbing inflation and maintaining economic stability.
The potential impact of the Federal Reserve’s tightening policy on crypto is reminiscent of the events in 2022 when Bitcoin cracked, falling from 2021 peaks to below $16,000 in late 2022. While Bitcoin’s potential to serve as a store of value, akin to gold, during times of crisis can be a possibility in 2023 and the future, analysts still view it as a “risky” asset.
From a bullish lens, Bitcoin will halve its miner rewards from 6.25 BTC in 2024. This reduction may cause a supply shock, making BTC scarcer, and may support prices in the second half of next year.
origin »Bitcoin price in Telegram @btc_price_every_hour
ChartEx (CHART) на Currencies.ru
|
|