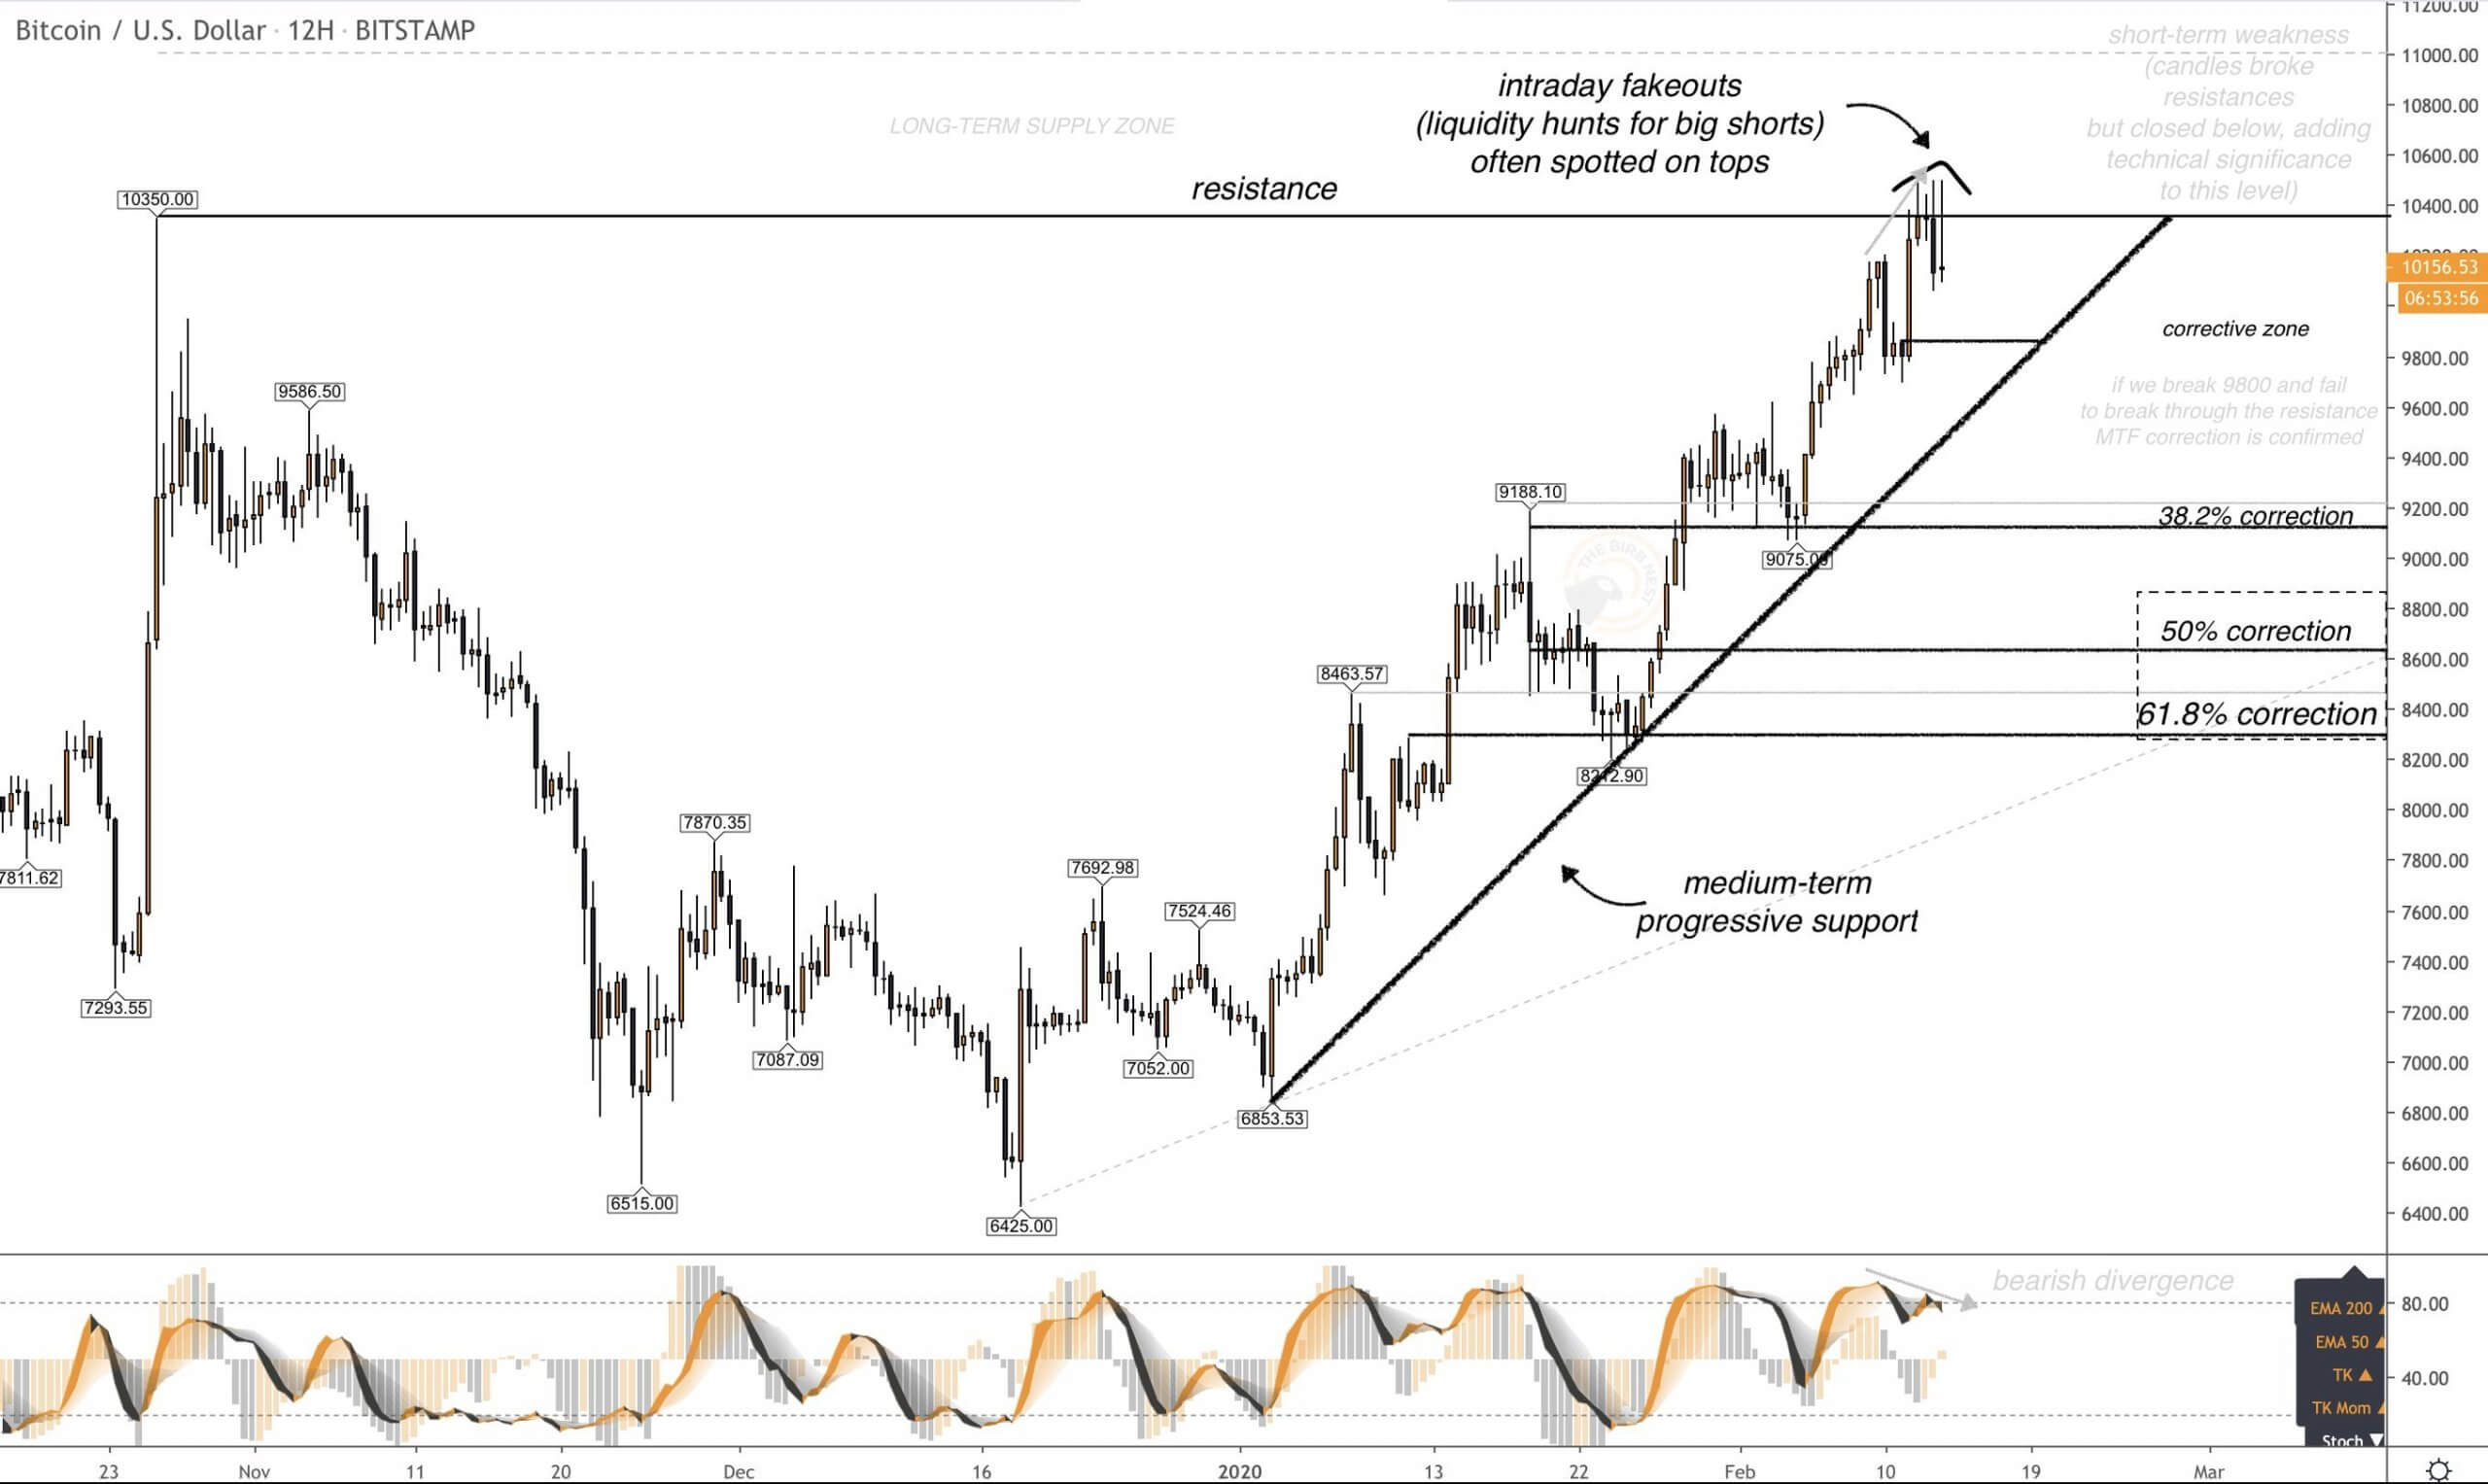
Bitcoin’s correction over the past few days has made investors fear the worst is yet to come for the market. Indeed, after a multi-week surge that brought the asset from $6,400 to $10,500, a 10% sell-off in a single day was shocking, leaving many wondering if a bear trend is on the verge of forming.
While there is some validity to these fears — Bitcoin recently broke below an ascending channel it was trading in for weeks on end — three technical factors suggest that bulls remain in control, despite the correction we saw in the middle of last week.
Factor #1: RSI is Holding Strong; Uptrend Remains Intact
The first factor is the Relative Strength Index (RSI), which measures momentum through the magnitude of price action. The indicator’s one-day reading for Bitcoin just bounced off the 50 baseline for the first time in this bull trend, suggesting buyers still have control.
$BTC – Bulls still have control with the daily RSI above 50… #bitcoin pic.twitter.com/5VLwYUQiwL
— Big Chonis Trading (@BigChonis) February 23, 2020
Chonis isn’t the only one who has drawn importance to Bitcoin’s RSI reading of 50. Previously, trader Financial Survivalism said that the metric flipping 50 into support and then holding it was a positive sign for this market.
Factor #2: Interest Is Rising
This has been underscored by the fact that interest in Bitcoin and related topics is rapidly rising. With retail interest being the catalyst that sent the cryptocurrency market so much higher in 2017, the growth in mom & pop investors entering the industry once again has been seen by many as a positive sign.
According to Google Trends the search term "halving" or "halvening" climbed dramatically from April to June 2019 up to the 14k price peak.
It started to climb again since Dec 2019 when there was a higher low.
My conclusion: #Bitcoin price will be higher in May 2020. pic.twitter.com/y2Q5o1mxbS
— BitcoinEconomics.io (@BitcoinEcon) February 23, 2020
Factor #3: Money Continue to Flows Into Bitcoin
The existence of swelling levels of interest in Bitcoin has been underscored by the Chaikin Money Flow indicator, which is still holding above the zero baseline, suggesting money is flowing into the market.
$BTC – CMF remains above zero line in a falling channel… there is still money flowing into #bitcoin , although notably less than a few weeks ago… pic.twitter.com/7Lr0i97Ws5
— Big Chonis Trading (@BigChonis) February 23, 2020
Bonus Factor: Bitcoin is Holding $9,500
Trader CryptoDude just the other day posted the below chart, showing a silver lining with Bitcoin’s recent price action: BTC has printed three long daily wicks into the $9,300 to $9,500 region, though failed to close a daily candle under $9,500.
This suggests that there remains a large amount of buying demand, adding to the potential for a greater recovery (potentially above $10,000) in the coming days.
Indeed, a number of analysts have said that $9,500 is “major support” for Bitcoin that must hold into the future. Crypto Bullet, for instance, laid out the following reasons as to why $9,500 is crucial for bulls:
The region around $9,500 has been a long-time “strong” horizontal level for Bitcoin, often acting as a reversal point for bears when approached from above and a reversal for bulls when approached from below.
This level is the 0.5 Fibonacci Retracement level of the drop from $14,000 to $6,400. The 0.5 Fibonacci level is often significant in markets.
$9,500 is a high-volume node per the VPVR.
The 200 exponential moving average on the four-hour chart is currently sitting around $9,500, just below the current price of the cryptocurrency. Importantly, this level is a moving target as it is a moving average.
Featured Image from Shutterstock origin »
Bitcoin hasn’t fared too well over the past few days, tumbling as low as $9,500 on Monday as sellers have started to liquidate their stacks en-masse. This meant that at the current correction’s worst, BTC was down just around 10% from the local $10,550 high that was set last week. While this plunge seemingly marks...
Bitcoin price slid away from $10,000 over the weekend inviting renewed predictions of how low the price could go if the correction continues. Bitcoin Broke Toward $9,500, Resparking Deep Correction Fears Bitcoin has started breaking below support levels, most recently crashing below $9,700, as previous price levels once again turn into areas of resistance.
Bitcoin started a downside correction from the $10,500 area against the US Dollar. BTC declined below $10,200, but it is still holding the key 100 hourly SMA. Bitcoin price failed to climb above $10,500 and corrected lower against the US Dollar.
The Bitcoin price is recovering after a pullback from $10,500, a level that is widely considered to be a heavy level of resistance. Analysts anticipate a revisit to the $9,000s in the short-term, but the sentiment remains highly optimistic.
Bitcoin's second attempt at surging above $10,000 is alive; however, not a lot of positions survived after the latest drop. The 3.30% drop in Bitcoin's price from $10,500 to $10,153 contributed to theThe post Bitcoin's unpopular correction causes liquidation of longs worth $16 million appeared first on AMBCrypto.
Bitcoin extended its rise towards the $10,500 resistance area against the US Dollar. BTC is now showing signs of exhaustion and it could dip a few points before continuing higher. Bitcoin price is struggling to gain momentum above $10,400 and $10,450 against the US Dollar.
Bitcoin price remained well bid above $9,000 and rallied to a new 2020 high against the US Dollar. BTC is now trading nicely above $9,500 and signaling a strong increase to $10,000. Bitcoin is showing positive signs above the $9,500 and $9,600 levels against the US Dollar.
The S&P 500 remains bullish as it continues rising. A financial firm says the bear case is stronger than ever due to record valuations.
The post S&P 500 Due for Major Correction as Valuations Soar to Unprecedented Levels appeared first on CCN.com
Bitcoin spiked above $9,400 and $9,500 against the US Dollar. BTC traded to a new yearly high at $9,569 and it is currently showing signs of a downside correction. Bitcoin price is likely forming a short term top near the $9,570 level against the US Dollar.
Coinspeaker Bitcoin Price Returns Beneath $8,500 Level, Solid Barrier Accelerates Sell-offWhile support remains at the $8,450 level, Bitcoin has the probability of the correction in the direction of $9,000.
S&P 500 may be due for a correction in the next two weeks as many large caps are overbought. This doesn't mean that bull run is over.
The post Warning! The S&P 500 Is Ripe for a Nauseating Plunge appeared first on CCN.com
Bitcoin failed to extend gains above $9,200 and started a downside correction against the US Dollar. BTC price tested the $8,500 support and it could bounce back. Bitcoin price is down more than 5% from the $9,186 high against the US Dollar.
Bitcoin Satoshi’s Vision (BSV) entered a massive bull rally which saw the coin’s price increase by 5x. As the crypto community questions the sudden upswing, a technical pattern estimates that BSV is bound for an inevitable correction.
Bitcoin price started a downside correction after rallying to a new 2020 high near $8,460 against the US Dollar. BTC corrected $500, but the price is still above many key supports. Bitcoin failed to continue above $8,500 and started a downside correction against the US Dollar.
Bitcoin price tested the crucial $6,500 support area and started an upside correction against the US Dollar. The price is up around 10% and it even settled above the $7,000 resistance area. Yesterday’s key bearish trend line was breached with resistance near $7,060 on the hourly chart of the BTC/USD pair (data feed from Kraken).
The Dow, S&P 500, and Nasdaq struggled to build on last week’s rally as investors digested conflicting trade war headlines. Meanwhile, the stock market is now at its most expensive since last year’s violent correction.
Bitcoin price is gaining bullish momentum and is trading above $9,500 against the US Dollar. The price is facing a strong resistance on the upside near the $9,820 and $9,850 levels. There is a crucial bullish trend line forming with support near $9,500 on the hourly chart of the BTC/USD pair (data feed from Kraken)....
The S&P 500 extended its recovery on Friday, adding to Thursday’s solid bounce following an intense two-day stock market correction. The bullish price action prompted many traders to predict that the market’s bellwether index had already bottomed out.
Bitcoin threatens to break above $11,000 once again after its recent drop to $9,500. Although BTC dominance appears overdue for a major correction, it still remains bullish from a technical perspective.
The total crypto market cap started a downside correction from the $315. 0B swing high. Bitcoin price declined below $11,500 and tested the $11,200 support area. BCH price is gaining momentum and it is currently trading above the $330 resistance.
Beginning yesterday, the market has gone through a price correction. For Bitcoin, after climbing as high as $12,200, the market began correcting seeing Bitcoin lose the $12,000 position and further decline to the $11,500 position.
The total crypto market cap corrected lower after a solid run towards $215. 0B. Bitcoin price is currently trading above the $11,500 support after a strong downside correction. Litecoin (LTC) price is now trading below the $95.
The price of bitcoin has corrected by 27. 7 percent from its year-to-date high of $13,868. 44. And the stark drop is making a billionaire investor nervous. A Nail-Biting Novogratz Galaxy Digital founder and chief executive Michael Novogratz today admitted that he would be worried if bitcoin’s near-term downtrend continues any further.
BCH /USD Medium-term Trend: Ranging Resistance Levels: $480, $500, $520 Support Levels: $280, $260, $240 Last week the price of Bitcoin Cash was trading in a range-bound move below the 12-day EMA and the 26-day EMA.
On July 31, the U. S. Federal Reserve and its chairman Jerome Powell officially announced a 25-basis point cut. The U. S. stock market and the S&P 500 reacted with a sharp correction, indicating that the rate cut has been priced into the equities markets.
BCH /USD Medium-term Trend: Ranging Resistance Levels: $480, $500, $520 Support Levels: $300, $290, $280 Last week the price of Bitcoin Cash was in a range bound move below the 12-day EMA and the 26-day EMA.
The cryptocurrency market is quite mundane following an action-less weekend session. Bitcoin price briefly stepped above $11,000 but immediately corrected towards the key support at $10,500. Investors do not mind the calmness across the market as the last couple of weeks have been nothing but a rollercoaster ride.
BCH/USD Long-term Trend: Bullish Resistance levels: $480, $500, $520 Support levels: $300, $280, $260 The price of Bitcoin Cash was in the bullish trend zone. From the price action on June 25, the bulls were resisted after testing the $480 price levels.
BCH /USD Medium-term Trend: Ranging Resistance Levels: $480, $500, $520 Support Levels: $300, $290, $280 Yesterday, July 18, the price of Bitcoin Cash was in a range bound move below the 12-day EMA and the 26-day EMA.
Bitcoin price declined heavily and traded below the $10,000 and $9,500 levels against the US Dollar. The price traded close to the $9,100 level and recently started an upside correction. Yesterday’s highlighted key bearish trend line is still active with resistance near $9,740 on the hourly chart of the BTC/USD pair (data feed from Kraken).
Bitcoin (BTC) has been absolutely slammed over the past week. Since passing above $13,000 for the second time this year last Wednesday, the crypto has been on a clearly downward-sloping trend. Related Reading: Bitcoin Blasts Below $10K, Following Senate Hearing on Facebook Crypto In fact, as of the time of writing this article, Bitcoin has.
Bitcoin price started a decent upside correction after trading as low as $9,784 against the US Dollar. The price traded above the $10,500 and $10,800 resistance levels to start the recent recovery.
After a 17% pullback Bitcoin price bulls appear to be fighting to retake $11000 but will they succeed? Bitcoin Price In Bullish Uptrend On Monday Bitcoin price reversed course and added 12. 5% as an attempt to make up for the weekend’s steep 17% drop from $11,500.
On the upside, the crypto’s price will rise and test or break the trend line. The first downward correction was below the EMAs at the $411 price level. BCH /USD Medium-term Trend: Bearish Resistance Levels: $480, $500, $520 Support Levels: $300, $290, $280 Last week the price of Bitcoin Cash was in a range bound […]
On the downside, if the $320 support level is broken, the BCH coin may depreciate to the previous low at $280 price level. On the other hand, if the $320 support level holds, the downward correction may have ended.
Coinspeaker Bitcoin Price & Technical Analysis: It’s Nothing Awful in the BTC CorrectionThe BTC has been undergoing a correction for two days already. Generally it is trading at $11,500.
BCH /USD Medium-term Trend: Ranging Resistance Levels: $480, $500, $520 Support Levels: $320, $380, $360 Yesterday, July 9, the price of BCH was in a range bound move below the 12-day EMA and the 26-day EMA.
On the upside, if the $400 price level holds, the bulls will make an upward move to retest $480 resistance level. After the downward correction on June 30, the crypto’s price fell to a low at $400 price level.
The bitcoin downtrend that started last week has continued in this new week. In the past few days, bitcoin (BTC) has witnessed a more than 20% decline from its 2019 all-year high. Bitcoin is trying to recover lost ground but the bulls are unable to push the price upwards.
The long-awaited Bitcoin price correction has failed to materialize yet again as the king of crypto has held on to gains over the weekend. Consolidation around $12000 appears to be forming and the uptrend is still clearly very strong.
The BCH market was in a downward correction after testing the $457 overhead resistance. The market fell to a low at $384 price level and resumed a range bound move above the 12-day EMA and the 26-day EMA.
Bitcoin [BTC] broke $8,500 following yesterday’s massive surge which pushed its market cap over $150 billion for the first time in months. With the king coin sitting pretty and set to break-out over $9,000, many in the community are optimistic.
Another crypto correction was quashed this week as Bitcoin failed to fall lower than $7,500. This has increased the general momentum for altcoins and today’s top performer by a clear margin is Litecoin which has surged 18 percent on the day.
EOS price rallied above the $6. 500 level before starting a downside correction. EOS is currently holding an important support and it could rally along with the ETH, XRP and BTC. Key Talking Points EOS price.
With the current market recovering from the recent Bitcoin [BTC] pull back dragging the price of Bitcoin under $7,500, a hunt has ensued for the source. Bitstamp, the Japanese cryptocurrency exchange which saw a crucial order set tremors in the market is the touted source, however, some dispute this claim.
From the Fibonacci tool, the downward correction was made to the support of the 0. 382 retracement level. The implication is that the 0. 382 retracement level is likely to hold, and the crypto’s price will rise to revisit the previous highs $8,000 and $8,500.