2020-12-17 08:28 |
Ethereum started a strong surge above $600 and $620 against the US Dollar. ETH price tested the $650 resistance zone and it is currently correcting gains.
Ethereum gained bullish momentum after it broke the $600 resistance level. The price is up more than 10% and it is now well above the 100 hourly simple moving average. There was a break above a key contracting triangle with resistance near $625 on the hourly chart of ETH/USD (data feed via Kraken). The pair is currently correcting lower from the $652 high, but it might find support near $630. Ethereum Price Turns GreenAfter forming a support base, Ethereum broke the main $595 and $600 resistance levels. More importantly, bitcoin price broke the $20,000 hurdle and surged higher. It resulted in a sharp increase in ETH price above the $620 resistance zone.
The bulls took over and there was a strong 10% upward move towards $650. There was also a break above a key contracting triangle with resistance near $625 on the hourly chart of ETH/USD. Ether price even spiked above $650 and settled well above the 100 hourly simple moving average.
A high is formed near $652 and the price is currently correcting lower. There was a break below the $645 and $640 levels. Ether tested the 50% Fib retracement level of the upward wave from the $616 swing low to $652 high.
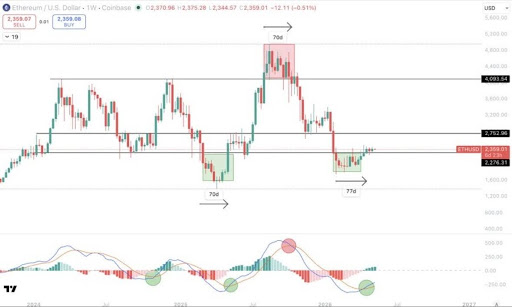
Source: ETHUSD on TradingView.comIf there are more downsides, the price might find a strong support at $630. It is close to the 61.8% Fib retracement level of the upward wave from the $616 swing low to $652 high. On the upside, the price is facing a major hurdle near the $650 level.
A successful close above the $650 level could spark another rally. The next key resistance is near $680, above which the price could test $700.
Dips in ETH?If ethereum continues to move down, the $635 and $630 levels are important zones. A downside break below the $630 level might call for a test of the $620 support level.
The main uptrend support is now forming near the $600 level (the recent breakout zone). Any more losses may possibly change the trend line the short term for a test of $565.
Technical Indicators
Hourly MACD – The MACD for ETH/USD is slowly losing momentum in the bullish zone.
Hourly RSI – The RSI for ETH/USD is currently correcting lower from the 70 level.
Major Support Level – $630
Major Resistance Level – $650
origin »Bitcoin price in Telegram @btc_price_every_hour
Ethereum (ETH) на Currencies.ru
|
|