2022-3-3 08:28 |
Ethereum failed to surpass $3,050 and corrected lower against the US Dollar. ETH price is declining and might test the $2,800 support zone in the near term.
Ethereum failed to continue higher above $3,040 and started a downside correction. The price is now trading above $2,880 and the 100 hourly simple moving average. There was a break below a key bullish trend line with support near $2,960 on the hourly chart of ETH/USD (data feed via Kraken). The pair could extend decline towards the $2,800 support if it breaks the 100 hourly SMA. Ethereum Price Corrects LowerEthereum was able to surpass the $3,000 resistance level. However, ETH failed to gain momentum above the $3,040 level. A high was formed near $3,042 and the price started a downside correction.
There was a move below the $3,000 and $2,950 levels. Besides, there was a break below a key bullish trend line with support near $2,960 on the hourly chart of ETH/USD. The pair traded below the 23.6% Fib retracement level of the recent wave from the $2,560 swing low to $3,042 high.
It is now trading above $2,880 and the 100 hourly simple moving average. On the upside, ether price is facing resistance near the $2,930 level.
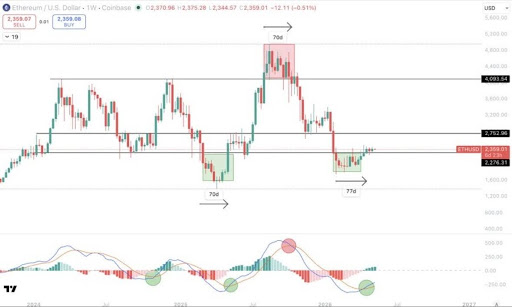
Source: ETHUSD on TradingView.comThe first major resistance is seen near the $2,950 and $2,960 levels. The main resistance is still near the $3,000 and $3,050 levels. A clear move above the $3,050 level might open the doors for a steady increase. In the stated case, the price may possibly rise towards the $3,120 level or even $3,200.
More Downsides in ETH?If ethereum fails to start a fresh increase above the $2,950 level, it could extend decline. An initial support on the downside is near the $2,880 level and the 100 hourly simple moving average.
The next major support is near the $2,840 level, below which the price might decline towards the $2,800 support. It is near the 50% Fib retracement level of the recent wave from the $2,560 swing low to $3,042 high. Any more losses might call for a move towards the $2,750 level in the near term.
Technical Indicators
Hourly MACD – The MACD for ETH/USD is now gaining pace in the bearish zone.
Hourly RSI – The RSI for ETH/USD is now below the 50 level.
Major Support Level – $2,880
Major Resistance Level – $3,000
origin »Bitcoin price in Telegram @btc_price_every_hour
Ethereum (ETH) на Currencies.ru
|
|