2020-5-5 08:58 |
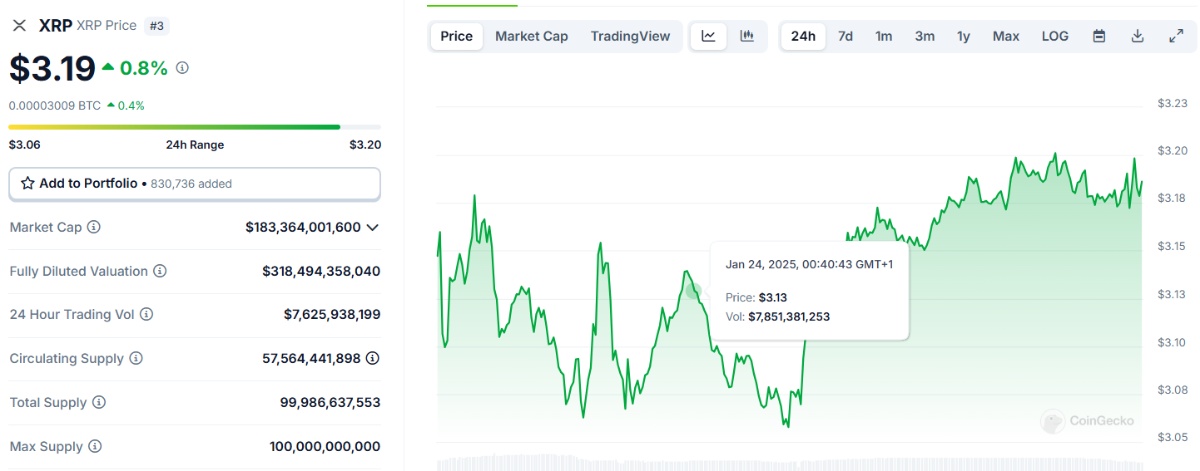
Ripple failed to stay above the $0.2200 support and declined recently against the US Dollar. XRP price is showing bearish signs and it could continue to dive towards $0.2000. Ripple price topped near the $0.2269 level and declined recently against the US dollar. It is now trading well below the $0.2200 pivot level and the 100 hourly simple moving average. There was a break below a key bullish trend line with support near $0.2185 on the hourly chart of the XRP/USD pair (data source from Kraken). The pair is likely to continue lower towards the $0.2000 support level in the near term. Ripple Price Could Extend Losses After a steady rise, ripple struggled to continue above the $0.2260 and $0.2280 levels. XRP formed a short term top near the $0.2269 level and recently started a strong decline. There was a break below the key $0.2200 support and the 100 hourly simple moving average. More importantly, there was a break below a key bullish trend line with support near $0.2185 on the hourly chart of the XRP/USD pair. Ripple Price The pair is now trading well below the 76.4% Fib retracement level of the upward move from the $0.2084 low to $0.2269 high. Ripple is now trading near the last swing low at $0.2085. If the bears remain in action, there is a risk of more losses below $0.2080. An immediate support is seen near the $0.2040 level. The first key support is near the $0.2000 area. The 1.618 Fib extension level of the upward move from the $0.2084 low to $0.2269 high is the next major support near the $0.1970 level. Any further losses could open the doors for a larger decline towards the $0.1920 and $0.1900 support levels. Key Hurdles Ripple is clearly trading in a short term bearish zone below the $0.2150 and $0.2100 levels. If the price attempts a recovery, it could face hurdles near the $0.2120 level. The main resistance is near the $0.2200 level and the 100 hourly SMA, above which the price is likely to retest the $0.2265 pivot level in the coming sessions. Technical Indicators Hourly MACD – The MACD for XRP/USD is gaining pace in the bearish zone. Hourly RSI (Relative Strength Index) – The RSI for XRP/USD is currently declining and it is well below the 35 level. Major Support Levels – $0.2040, $0.2000 and $0.1970. Major Resistance Levels – $0.2120, $0.2200 and $0.2220. Take advantage of the trading opportunities with Plus500 Risk disclaimer: 76.4% of retail CFD accounts lose money. origin »
Bitcoin price in Telegram @btc_price_every_hour
Ripple (XRP) на Currencies.ru
|
|