2021-3-2 13:59 |
Ripple (XRP) plunged to lows of $0.39, its lowest price level since 23 February
XRP is looking to strengthen above $0.40 after rebounding off lows of $0.39 over the weekend. Ripple bulls are hoping for a fresh upside momentum, with targets above $0.45 currently capped by a key declining channel formation on the 4-hour chart.
The hourly chart also shows that XRP/USD is correcting losses suffered over the past week, with legitimate targets above $0.50 if bulls hold above a short-term ascending trendline.
Overall, if prices cross the $0.43 and then $0.45 resistance levels, the next targets would be north of $0.50. On the contrary, a dip and extended correction below $0.40 could see XRP move towards last month’s lows and even target sub $0.30 levels.
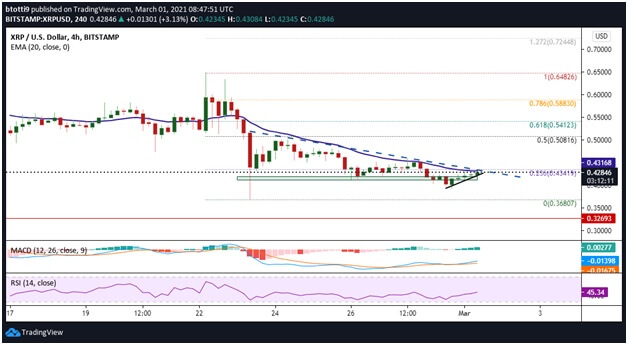
Ripple price 4-hour chartThe XRP/USD pair had failed to gain meaningful upside momentum since dipping below the $0.50 support level. The correction has seen prices remain below the 20-day exponential moving average, which currently caps XRP near $0.43.
However, bulls are looking to retake control as suggested by the RSI and MACD indicators on the 4-hour chart. Both indicators are pointing to a potential strengthening of the upside correction. The MACD is within the bullish zone and the RSI is suggesting a positive flip as it seeks to cut above the 50 level.
XRP/USD 4-hour chart. Source: TradingViewIf bulls break above the 20-day EMA and the 0.236 Fibonacci retracement level ($0.43), fresh buying pressure could see bulls target $0.50. But this would require bulls to push higher above the declining trend line.
Above the 0.5 Fib level ($0.50), bulls will fancy $0.54 and $0.58, resistance levels marked by the 0.618 and 0.768 Fib levels respectively. The next major hurdles are at $0.65 and $0.80.
Ripple price 1-hour chart XRP/USD hourly chart. Source: TradingViewXRP/USD remains within a declining triangle pattern on the hourly time frame, but a breakout is likely given bulls are looking to attack the resistance line.
If XRP/USD continues higher, a clear break above the resistance line of a declining pattern could see buyers target $0.45 and $0.47. If bulls gain further upside momentum above the two horizontal resistance lines, the next targets would be $0.50 and $0.54.
The hourly RSI is trending with a positive divergence to suggest bulls are gaining control above $0.40. The hourly MACD is also bullish and suggesting strengthening above the signal line.
However, if XRP declines below the 20-EMA ($0.42) a dip to the $0.40 support line could invite more selling pressure. In this case, further losses would highlight the need for bulls to defend gains at $.35 or risk falling to January lows of $0.30.
The post Ripple Price Analysis: XRP bounces off horizontal support near $0.40 appeared first on Coin Journal.
origin »Bitcoin price in Telegram @btc_price_every_hour
Ripple (XRP) на Currencies.ru
|
|