Pattern - Свежие новости [ Фото в новостях ] | |

Litecoin, IOTA, Monero Price Analysis: 09 September
Litecoin and IOTA were in a period of consolidation after the recent drop. Monero showed signs of recovery, while also exhibiting a bearish pattern that could see the price of the asset revisit its reThe post Litecoin, IOTA, Monero Price Analysis: 09 September appeared first on AMBCrypto. дальше »
2020-9-9 17:00 | |
|
|
Not Just DeFi, SaTT ICO Also Gained Well In The Cryptocurrency Market
The past weeks have been very eventful for the entire cryptocurrency space as DeFi becomes the hottest word on everyone’s lips. Just like the 2017 ICO incredible wave, DeFi is replicating the same pattern but a more sustainable one. дальше »
2020-9-9 13:35 | |
|
|
This Simple Technical Pattern Could Resend Ethereum Above $350
Ethereum is struggling to gain momentum above $340 and $350 against the US Dollar. ETH price could start a strong increase if it clears the 100 hourly SMA at $350. Ethereum is facing an uphill task near the $340 and $350 resistance levels. дальше »
2020-9-9 08:48 | |
|
|
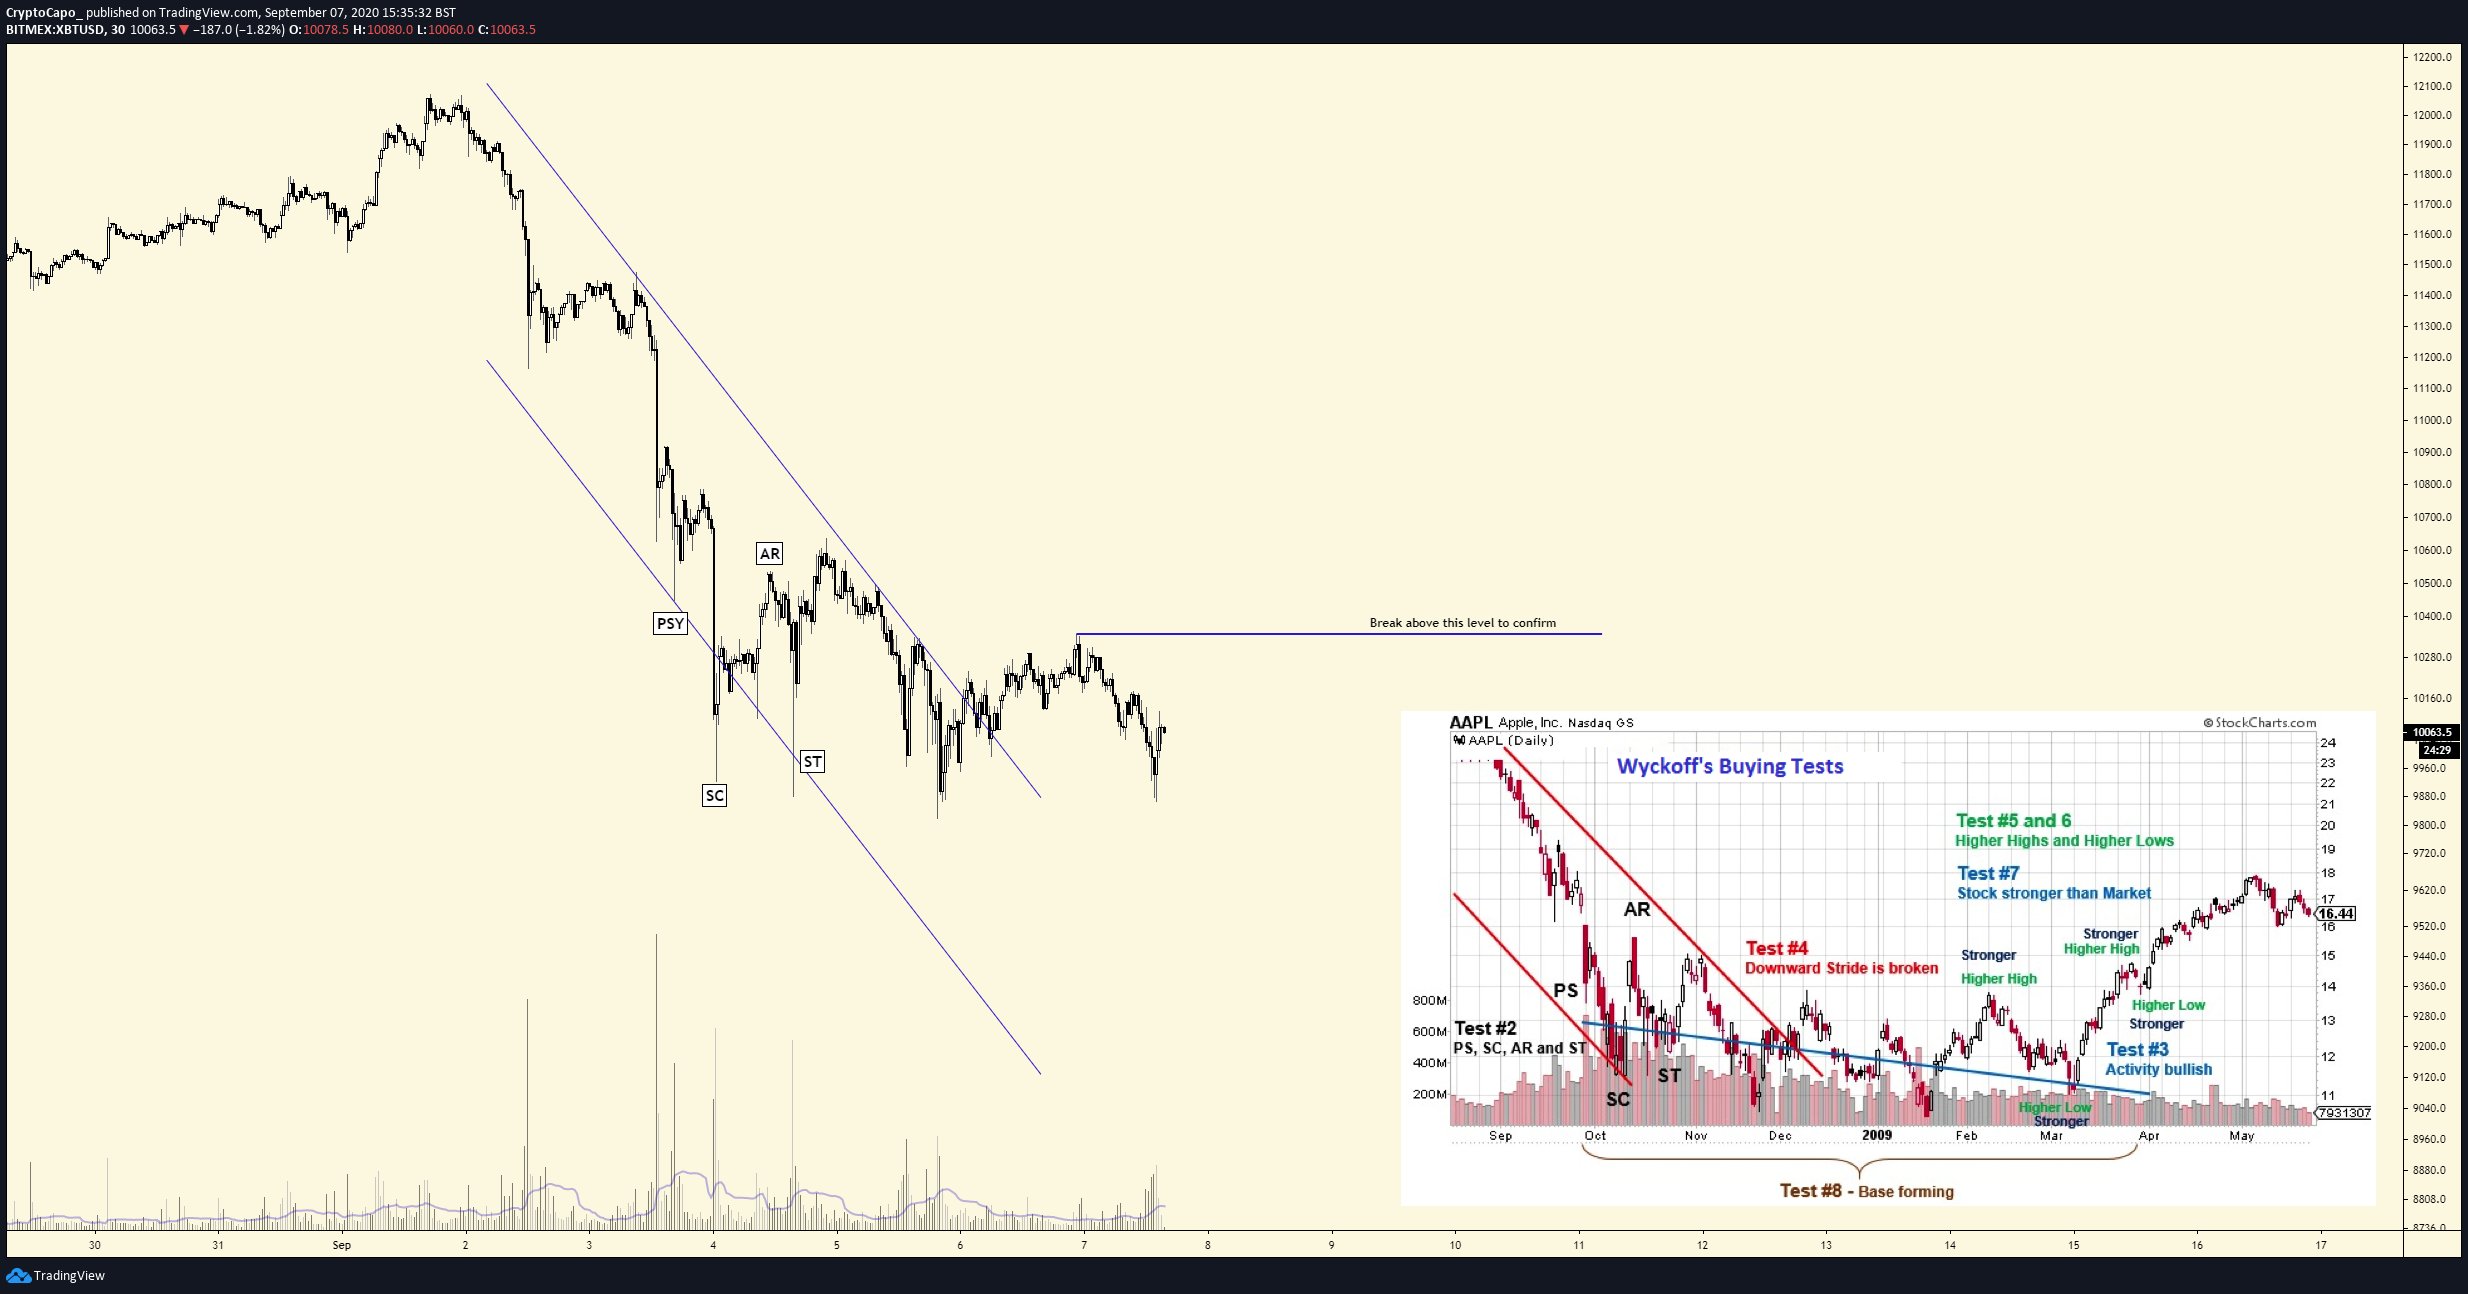
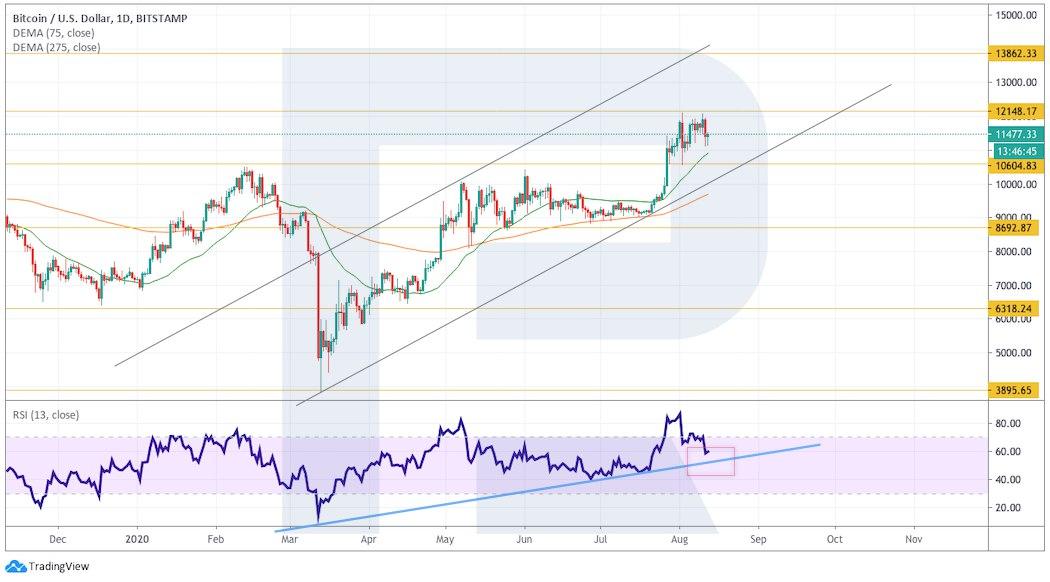
Bitcoin Closing Above $10,500 Could Confirm This Bullish Recovery Pattern
Bitcoin remains in a weak spot despite bouncing slightly from the $9,800 lows seen on the weekend. The leading cryptocurrency currently trades for $10,100 as of this article’s writing, down marginally in the past 24 hours. дальше »
2020-9-9 04:00 | |
|
|
Polkadot, IOTA, Compound Price Analysis: 08 September
Polkadot invalidated a possible bearish pattern in the past few sessions. At press time, it lacked momentum in both directions. IOTA was indicating signs of short term bullishness and could surge pastThe post Polkadot, IOTA, Compound Price Analysis: 08 September appeared first on AMBCrypto. дальше »
2020-9-9 23:00 | |
|
|
Bitcoin and Gold Correlation Leads to Matching Cup and Handle Patterns
Bitcoin and gold are regularly compared due to the similarities they share. But could those same similarities be the reason for each asset’s price charts forming the exact same continuation pattern? Across two very different timeframes, both the cryptocurrency and the precious metal are forming a cup and handle. дальше »
2020-9-8 18:00 | |
|
|
Ripple (XRP) Price is About to See “Liftoff”, As Key Technical Breakout Emerges
Ripple seems to be forming a strong support near $0. 2295 against the US Dollar. XRP price is showing breakout signs and it could start a significant recovery wave above $0. 2450. Ripple is up 2% and it cleared a major technical breakout pattern against the US dollar. дальше »
2020-9-8 10:48 | |
|
|
Bitcoin Could Recover Above $10,500 As Double Bottom Pattern Emerges
Bitcoin price retested the $9,900 zone against the US Dollar. BTC seems to be forming a double bottom pattern near $9,900 and it could start a decent increase above $10,500. Bitcoin bounced back above $10,200 after it retested the $10,000 and $9,900 levels. дальше »
2020-9-8 07:08 | |
|
|

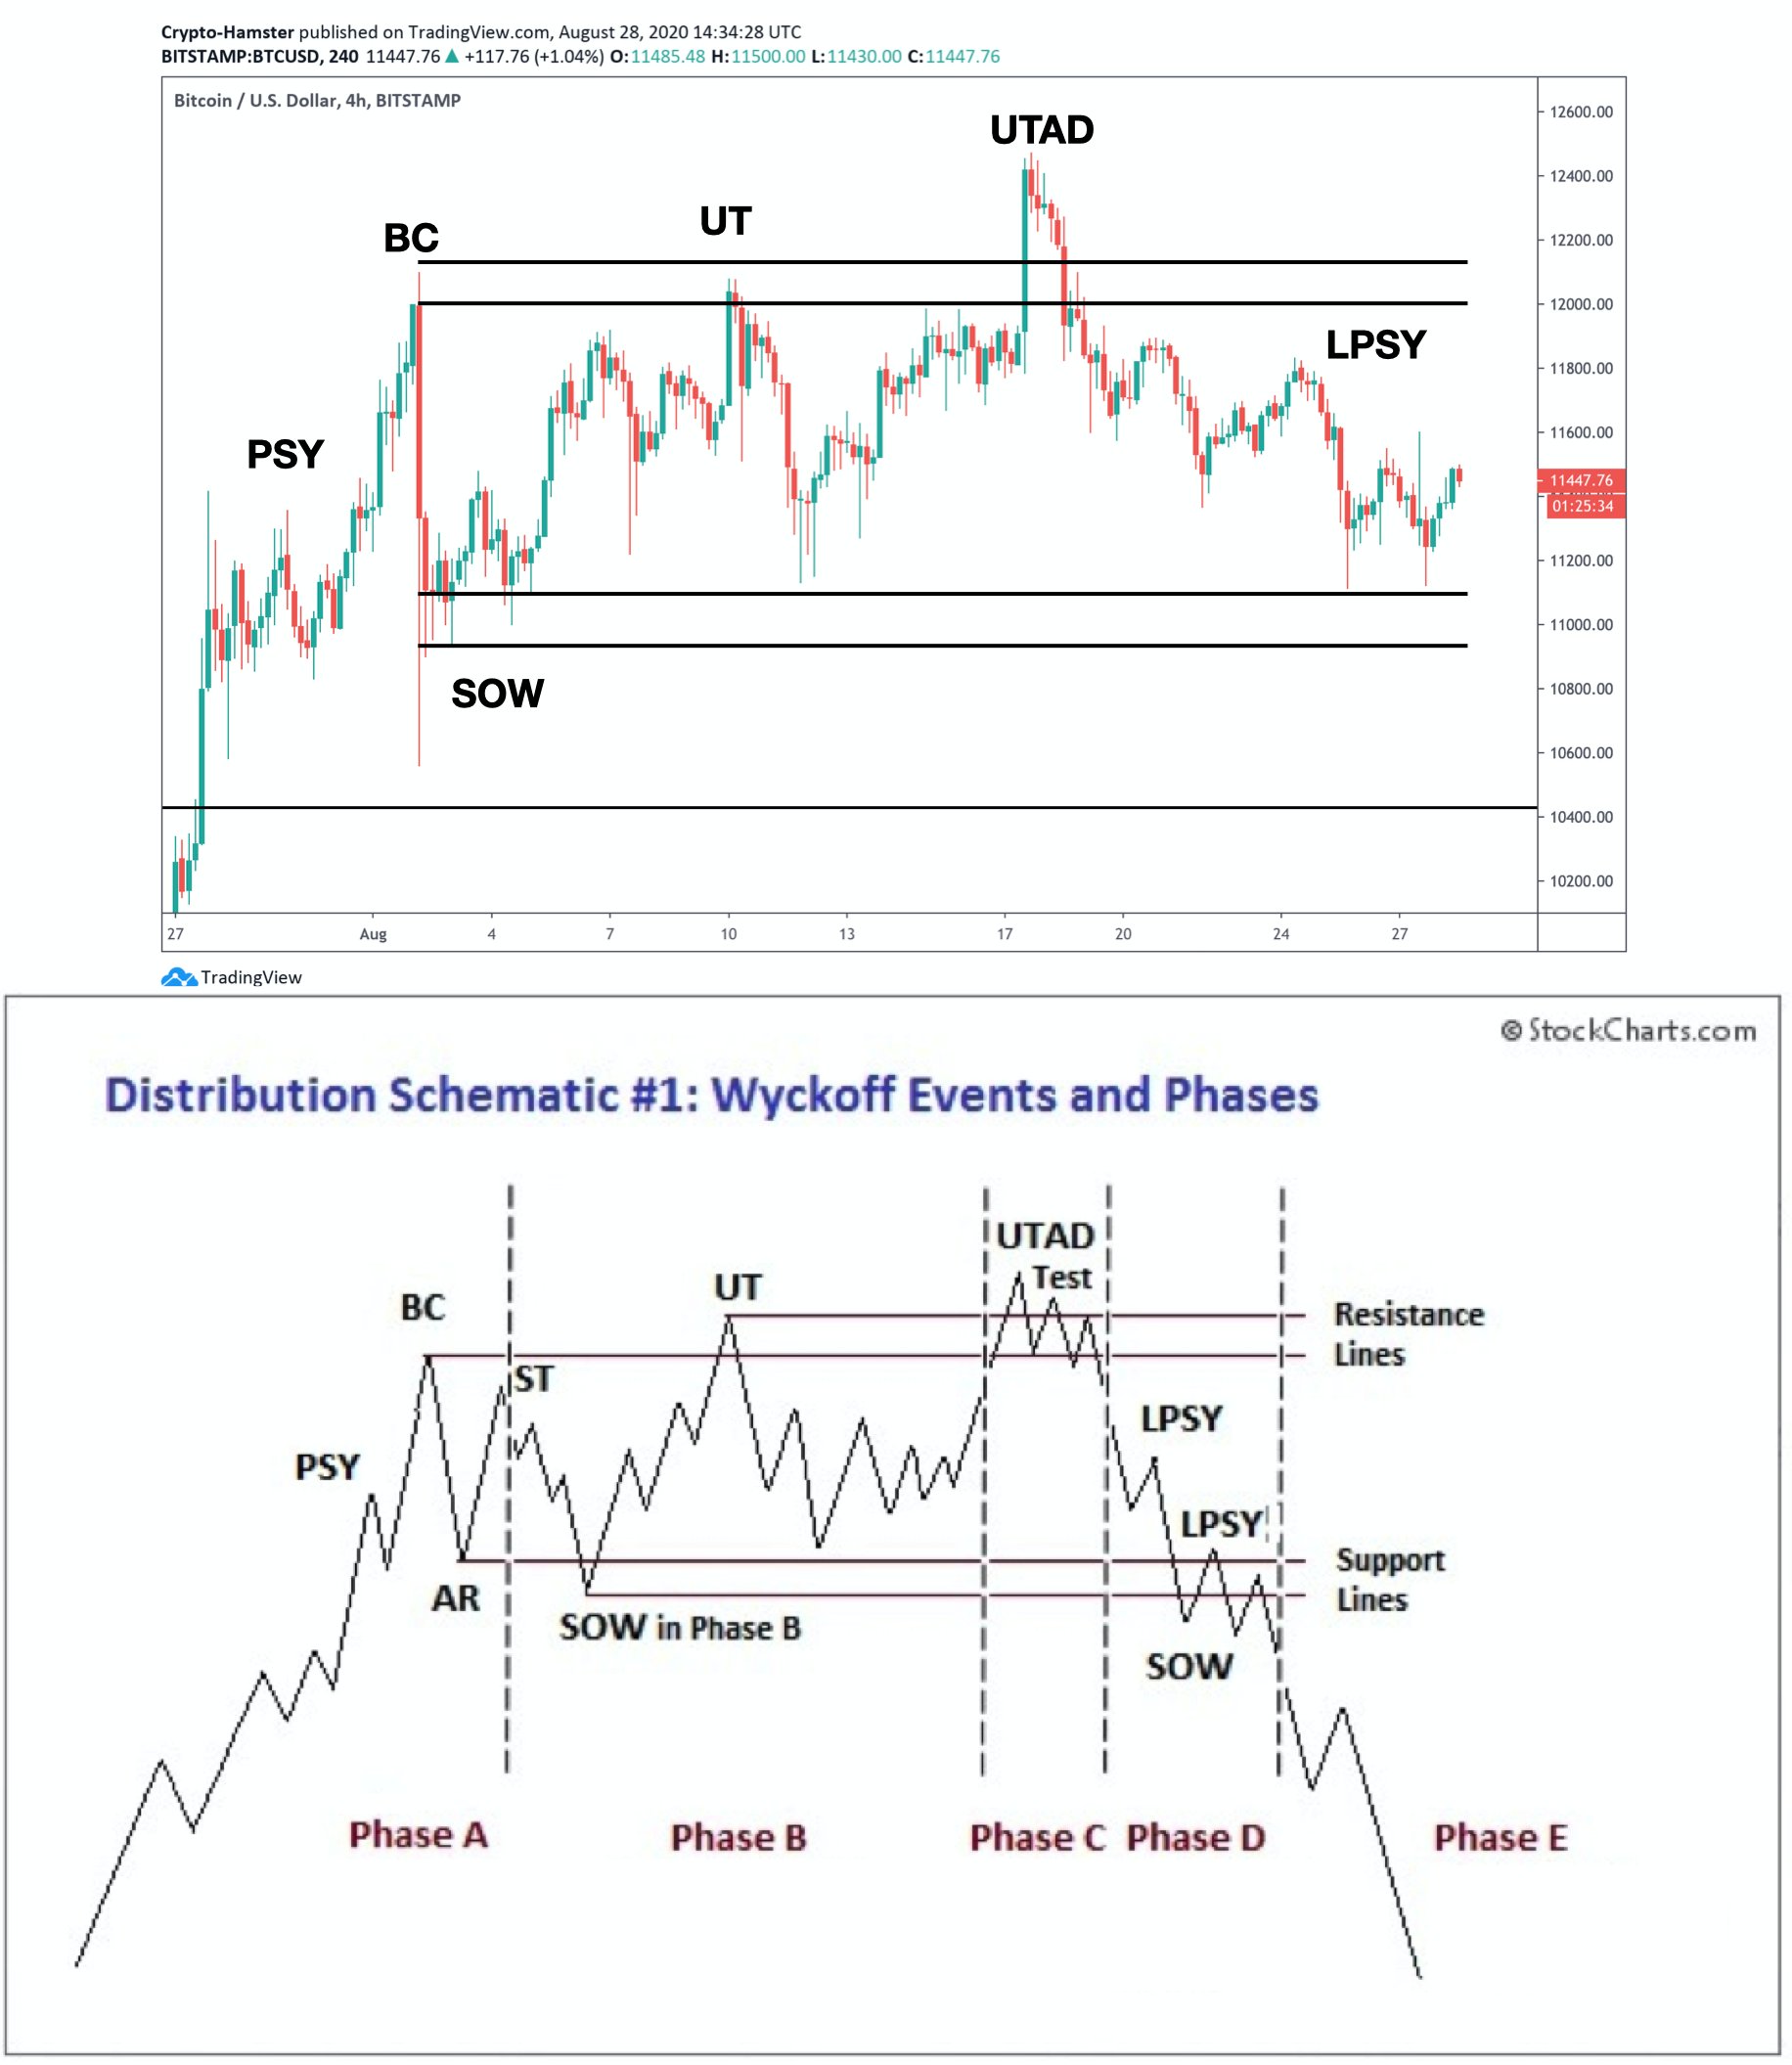
Bitcoin “Distribution” Could Lead To Another Arm And A Leg Down
Bitcoin price recently collapsed from $12,400 to under $10,000 after the cryptocurrency presented a near-perfect distribution pattern. If the pattern continues, the market could form a massive head and shoulders top, with a price target of significantly lower. дальше »
2020-9-8 04:00 | |
|
|
Steem, Polkadot, Litecoin Price Analysis: 07 September
Litecoin's charts showed that LTC was still caught in a strong downtrend, one that had not yet slowed down. Polkadot registered a potentially bearish pattern, one that could set up a sharp drop for thThe post Steem, Polkadot, Litecoin Price Analysis: 07 September appeared first on AMBCrypto. дальше »
2020-9-8 21:00 | |
|
|
Bitcoin At Potential Risk of Breakdown Below $10,000: Here’s Why
Bitcoin price traded to a new monthly low at $9,853 before correcting higher against the US Dollar. BTC is still following a bearish pattern and it is likely to accelerate lower below $10,000. Bitcoin is trading in a bearish zone below the $10,800 and $10,500 support levels. дальше »
2020-9-7 07:08 | |
|
|
Ethereum Is In Steep Downtrend And Technicals Suggest Crucial Breakout Pattern
Ethereum is down over $150 from the $490 swing high against the US Dollar. ETH price could continue to move down if it breaks the key $300 support zone. ETH price is back in a bearish zone below the $400 and $350 support levels against the US Dollar. It traded to a new multi-week low […] дальше »
2020-9-6 09:28 | |
|
|

Bitcoin Analyst Who Accurately Foresaw Feb Crash Says $9.8K is Next
Bitcoin is going to fall to $9,800, according to a pseudonymous analyst. The prominent daytrader cited the formation of a Head and Shoulder pattern behind his bearish analogy. In retrospect, H&S is a technical pattern described by three peaks. дальше »
2020-9-3 10:25 | |
|
|
Bitcoin SV, Ontology, FTX Token Price Analysis: 1 September
Bitcoin SV showed a bullish reversal pattern, indicating the possibility that BSV could rise to near $230 in the coming days. Ontology was trading in a rising channel and showed no signs of bears gainThe post Bitcoin SV, Ontology, FTX Token Price Analysis: 1 September appeared first on AMBCrypto. дальше »
2020-9-2 22:00 | |
|
|
Bitcoin and Ethereum Close the Month on the Bullish Side
Coinspeaker Bitcoin and Ethereum Close the Month on the Bullish SideBitcoin’s price action on Monday, August 31st, was quite uncertain. Although it seemed like a double bottom pattern had formed over the weekend, the erratic behavior seen on this day left many scratching their heads. дальше »
2020-9-1 13:54 | |
|
|

“Wise to Exit” Bitcoin Long Positions If This Happens
A bullish Bitcoin technical pattern that has held firm since October 2019 flashed once again this week. It is an uptrend–an ascending channel–wherein BTC/USD’s momentum indicator is making higher highs and higher lows. дальше »
2020-9-1 08:05 | |
|
|
Bitcoin Is Printing a Textbook Bearish Reversal Pattern: $9,000s in Play
Bitcoin’s recent rally has seemingly been bullish, bringing the asset above $10,500, then $11,500. As of this article’s writing, the cryptocurrency trades for $11,500. BTC may actually be trading in a textbook top pattern, though. дальше »
2020-8-30 02:00 | |
|
|

Current Bitcoin Price Action Closely Follows Textbook Distribution Pattern
Bitcoin bulls are currently attempting to turn weekly resistance at $11,500 into support. However, failure may be likely according to an ominous pattern the cryptocurrency is painting. Recent price action in the first-ever cryptocurrency closely mimics that of a Wyckoff distribution model. дальше »
2020-8-30 22:00 | |
|
|
Bitcoin Could Rally Above $11,500 As Double Bottom Pattern Emerges
Bitcoin price is forming a strong support and a possible double bottom near $11,140 against the US Dollar. BTC is likely to rally if it clears the $11,500 resistance. Bitcoin is showing a few positive signs above the $11,140 and $11,200 support levels. дальше »
2020-8-28 07:08 | |
|
|
XRP Flashes Buy Signal At Bottom Of Potential Falling Wedge Pattern, Breakout Imminent
From the August monthly open to the high, XRP recorded nearly 25% gains on the month. Unfortunately for Ripple investors hoping for a new bull run, the altcoin was only able to hold onto just 1% of that as of the time of this writing. дальше »
2020-8-28 23:00 | |
|
|
COMP Bounces at Important Support Level
The Compound (COMP) price has broken out from a descending resistance line and has created a bullish pattern. The price should continue moving upwards as long as it stays above $160. Breakout and Double Bottom The COMP price began an upward move on August 2, and on August 12, the price reached a high of […] The post COMP Bounces at Important Support Level appeared first on BeInCrypto. дальше »
2020-8-27 23:49 | |
|
|
Ethereum Potentially Trades Inside Livermore Accumulation Cylinder Pattern, New ATH Imminent
Ethereum has spent more than two years in being accumulated by smart money at low prices ahead of substantial markup. It has caused the asset to outperform most of the crypto market, including Bitcoin. дальше »
2020-8-27 23:00 | |
|
|

Bitcoin Analyst Makes A Serious Bearish Call: A Drop Below $10.2K
An ongoing correction in the Bitcoin market may lead the cryptocurrency lower below $10,500, according to Alexander Nikitin. The founder of MPS Trade, an independent trading consultancy portal, spotted BTC/USD in a Head & Shoulder breakdown pattern. дальше »
2020-8-26 11:08 | |
|
|
Ethereum is About to Confirm a Highly Bearish Pattern; Analysts Target $320
Ethereum has been trading in close tandem with Bitcoin in recent weeks, but this correlation showed some signs of degrading just a couple of days ago when the cryptocurrency rallied to highs of $410 while BTC remained stuck below $12,000. дальше »
2020-8-26 00:00 | |
|
|
Ethereum May Still Confirm a Pattern That Would Imply a Breakdown to $320
Ethereum has been pushing higher after reaching $380 late last week. The asset trades for $400 as of this article’s writing, bouncing around 5% from last week’s lows. At the highs on Monday, ETH traded for $410 as buyers stepped in en-masse. дальше »
2020-8-26 13:00 | |
|
|
Ethereum short-term price analysis: 24 August
Ethereum's recent decline seems to be in recovery considering the coin's 5.3% surge in the last 24 hours. This surge comes as the price breaks out of a bullish pattern. This has larger implications ofThe post Ethereum short-term price analysis: 24 August appeared first on AMBCrypto. дальше »
2020-8-24 21:00 | |
|
|

August 22 – Ripple (XRP) price could fall to $0.21 on this chart pattern
Ripple (XRP) price has fallen nearly 8% this week as the sellers take control of the price action. The sellers have been working on a specific bearish chart pattern that could eventually take the price action to low $0. дальше »
2020-8-23 21:29 | |
|
|

Chainlink Breaks Below Crucial Technical Pattern as Analysts Eye Downside
Chainlink has expressed some signs of overt weakness throughout the past few hours, with its price reeling down towards its bedrock support at $14.00. This sharp downturn has come about as the entire crypto market shows some signs of weakness, which may be, in part, rooted in Ethereum’s plunge towards $400. ETH’s price action has […] дальше »
2020-8-21 19:00 | |
|
|
These Two Lesser-Known Altcoins Have Potential to Soar
The DIA (DIA) price is trading inside a massive ascending triangle. If it’s able to break out from this pattern, it could take the price to 42,000 satoshis. Cryptocurrency trader @bitcoin_brown stated that two new projects, DIA and ERD are very bullish, having the potential for significant increases. дальше »
2020-8-21 18:49 | |
|
|

Bitcoin’s Cloud Pattern Shows Bears May Still Be in Full Control
Bitcoin and the entire cryptocurrency market are currently bearing witness to relatively mixed price action While BTC has faced some intense selling pressure, it is important to note that bears have not invalidated any of its mid-term market structures As such, it remains well-positioned to see further near-term upside Despite this, one analyst is noting that the cryptocurrency’s cloud formation may spell some trouble for its near-term outlook, as it shows that it is still […] дальше »
2020-8-21 02:00 | |
|
|

Chainlink (LINK) May Have Finally Run Out of Steam
The Chainlink (LINK) price reached a high of $20.09 on Aug 16 and has been decreasing since. It is possible that the price has reached a top and has now begun a long-term corrective period. LINK Makes an Evening Star Pattern The LINK price has been on a tear since Aug 2 when the price […] The post Chainlink (LINK) May Have Finally Run Out of Steam appeared first on BeInCrypto. дальше »
2020-8-20 17:12 | |
|
|
Litecoin is Flashing a Bearish Breakdown Pattern as Analysts Eye Downside
Litecoin has been flashing mixed price action in recent weeks, with its slow uptrend showing some signs of faltering Its momentum began stalling yesterday when it reached for highs of nearly $70 This seems to shine a light on some underlying weakness, potentially also signaling that further downside is imminent Analysts are noting that this weakness may lead it significantly lower in the near-term One trader is pointing to a breakdown pattern that LTC has […] дальше »
2020-8-19 23:00 | |
|
|
This Bullish Continuation Pattern Suggests Bitcoin Could Rally Above $12,500
Bitcoin price gained nearly 5% and it tested the $12,500 resistance against the US Dollar. BTC is currently correcting gains, but technicals suggest more upsides above $12,500. Bitcoin broke the main $12,000 resistance area to start a strong upward move. дальше »
2020-8-18 07:08 | |
|
|
Clear Pattern for LINK: Constant Buy Pressure, HODLing, & Shilling to Continue to Bring New Highs
Chainlink is on fire. As it has been throughout 2020. This past week, LINK continued to its new all-time highs, no surprise there. With more than 61% gains last week, LINK hit a new ATH at $19. 98 on Sunday. дальше »
2020-8-17 16:15 | |
|
|
This Textbook Chart Pattern Predicts Bitcoin Will Hit $13,000 Imminently
Bitcoin has stalled despite posting a weekly close above the pivotal $11,800 level that analysts eyed. BTC remains in a textbook bullish chart pattern. That pattern is an ascending triangle, which has been a pattern of importance throughout Bitcoin’s history. дальше »
2020-8-18 13:00 | |
|
|
It’s Decision Time for Bitcoin as Technicals Suggest a Crucial Breakout Pattern
Bitcoin price is trading in a range above the $11,700 support zone against the US Dollar. BTC is likely to surge higher once it clears the main $12,000 resistance zone. Bitcoin is trading in a positive zone above the $11,700 and $11,750 support levels. дальше »
2020-8-18 07:18 | |
|
|
Bitcoin short-term price analysis: August 16
Bitcoin was trading at $11,800 and showed signs of heading lower due to the formation of a bearish pattern. While some altcoins have seen a good surge in the last 24 hours, some haven't been so lucky. дальше »
2020-8-16 20:00 | |
|
|
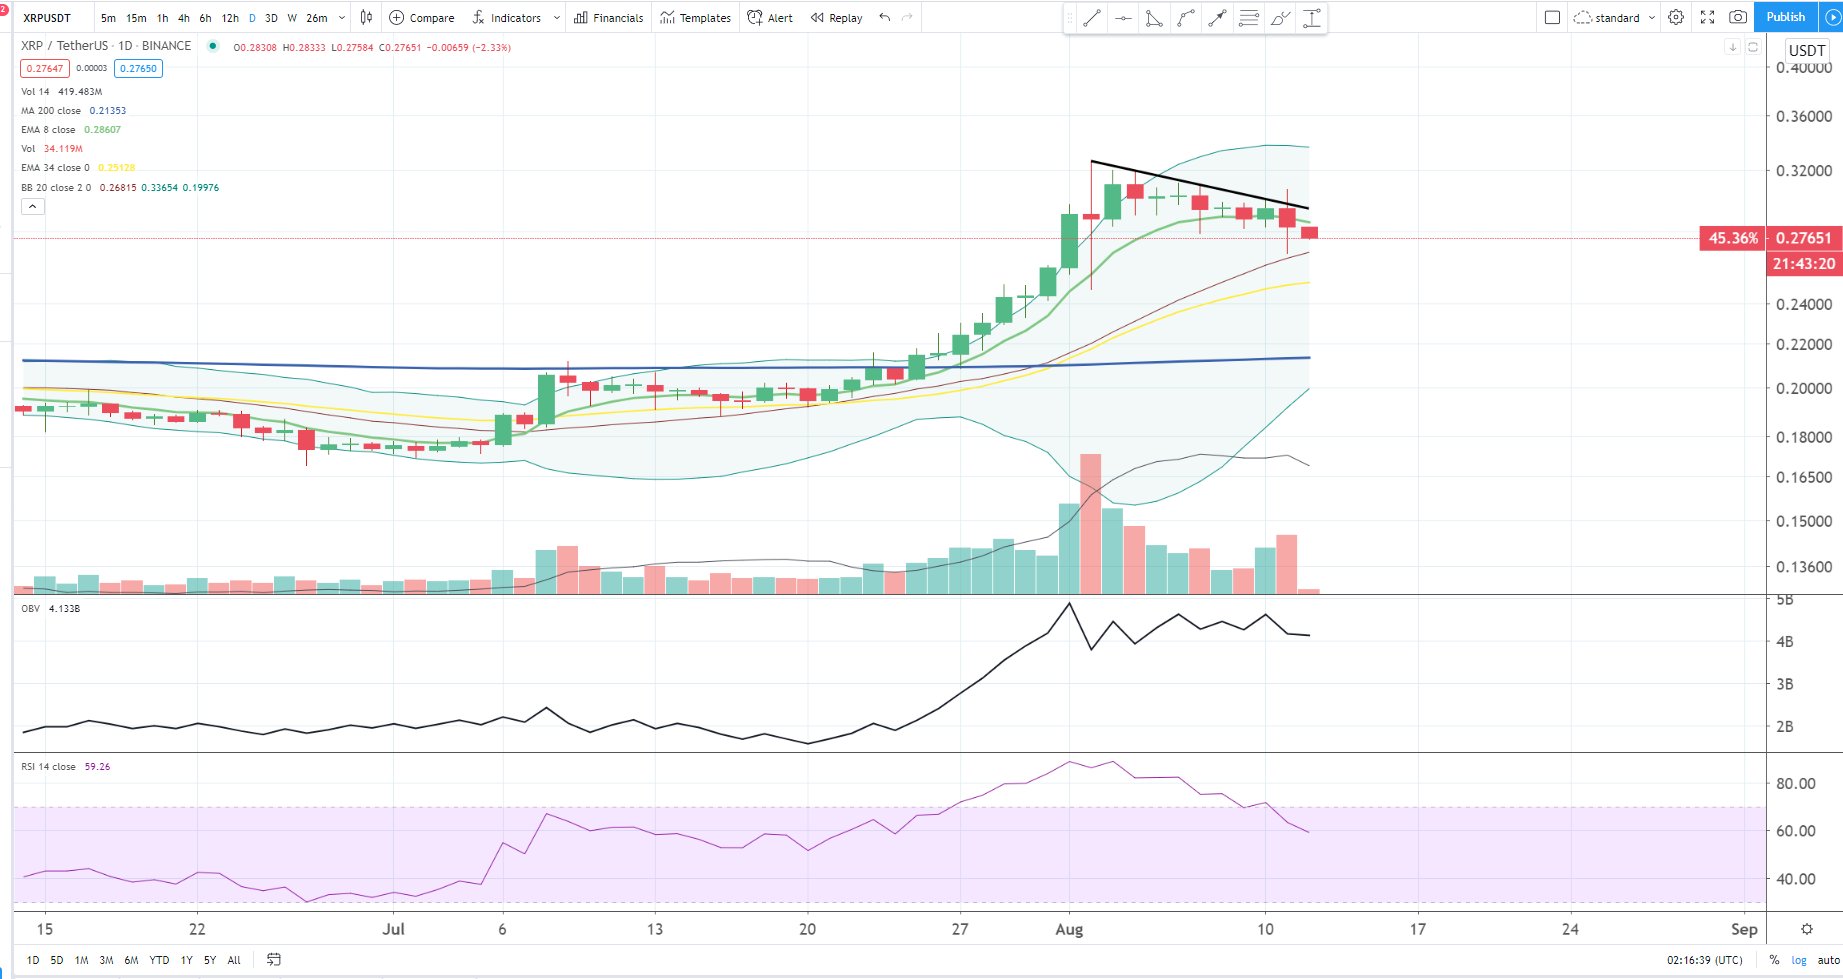
XRP: Why A Weekly Close Below 25 Cents Could Spark A Strong Reversal
After reaching above 30 cents last week, XRP has taken a step back to make a decision on where it wants to head next. A textbook doji closed on the weekly, reflecting indecision in the altcoin. According to a candlestick pattern potentially forming on the weekly following the doji, a fall below 25 cents will […] дальше »
2020-8-14 23:00 | |
|
|
Why Analysts Expect XRP Drop as the Cryptocurrency Slides Lower
XRP is preparing to plunge lower as the cryptocurrency forms a bearish price pattern. The cryptocurrency is actually down 1% in the past 24 hours, despite Bitcoin rallying a handful of percent. XRP’s underperformance of the leading digital asset may add pressure to its move to the downside. дальше »
2020-8-13 13:00 | |
|
|
Approach Altcoins With Caution: Bitcoin Dominance Paints Foreboding Pattern
Following Bitcoin’s big breakout weeks ago, altcoins have been rallying left and right. Several majors, mid, and small-cap altcoins have outperformed the first-ever cryptocurrency by a large margin. дальше »
2020-8-13 04:00 | |
|
|
Crypto Price Analysis August 12: BTC, ETH, LTC, EOS, XRP
Coinspeaker Crypto Price Analysis August 12: BTC, ETH, LTC, EOS, XRPCryptocurrencies are still correcting before another attempt to start a new bullish impulse. In charts of many cryptoassets, they are forming a Triangle pattern, a breakout of which to the upside may lead to the continuation of the current trend. дальше »
2020-8-13 19:21 | |
|
|
Bitcoin Creates Double-Top After Failing Close Above $12,000
While the Bitcoin (BTC) price has increased considerably over the past few weeks, it has failed to reach a close above a crucial long-term resistance area at $12,100. Instead, the price has created a bearish pattern and began a short-term downward movement. дальше »
2020-8-12 12:36 | |
|
|
Despite $500 “Bart” Pattern, Analysts Are Still Bullish on Bitcoin
Bitcoin surged past $12,000 on Monday morning, rallying as certain altcoins plunged. The move brought the cryptocurrency as high as $12,100. Just as fast as BTC rallied, though, it dropped. Just hours after $12,000 was tapped, Bitcoin plunged around $500 in the span of an hour, forming a “Bart” formation. дальше »
2020-8-11 15:00 | |
|
|
XRP Price Could Soon Rally 30% Towards $0.40 After Parabolic Surge
Over the past 24 hours, many facets of the altcoin market have ripped higher as Bitcoin, Ethereum, and XRP have entered a short-term consolidation pattern. As reported by NewsBTC, Chainlink (LINK) posted a 40% one-day performance at one point in the past 24 hours. дальше »
2020-8-9 07:00 | |
|
|
Bitcoin SV long-term Price Analysis: 07 August
Disclaimer: The following price prediction estimates Bitcoin SV's imminent bearish pullback. Over the past week, it is becoming increasingly difficult to estimate the breakout pattern of Bitcoin SVThe post Bitcoin SV long-term Price Analysis: 07 August appeared first on AMBCrypto. дальше »
2020-8-7 19:00 | |
|
|
Chainlink long-term Price Analysis: 06 August
Disclaimer: The following article attempts to analyze the evolving pattern in Chainlink's long-term market and its impact on LINK's price Unlike most cryptocurrencies in the market, Chainlink hasThe post Chainlink long-term Price Analysis: 06 August appeared first on AMBCrypto. дальше »
2020-8-6 19:30 | |
|
|
Bitcoin Cash short-term Price Analysis: 5 August
Disclaimer: The following article attempts to analyze the evolving pattern in the Bitcoin Cash short-term market and its impact on the price. A massive dump was witnessed across major cryptocurreThe post Bitcoin Cash short-term Price Analysis: 5 August appeared first on AMBCrypto. дальше »
2020-8-5 17:00 | |
|
|
This Newly Formed Structure Could Cause Bitcoin to See Major Losses
Bitcoin and the aggregated cryptocurrency market are currently in a precarious position following the series of strong rejections seen yesterday evening The selling pressure incurred as a result of these rejections has not yet been enough to force BTC or other assets below their crucial support levels That being said, analysts are growing increasingly cautious on BTC’s near-term outlook One trader explained that a recently emerged technical pattern seems to indicate downside is imminent It […] дальше »
2020-8-5 02:00 | |
|
|