Indicators - Свежие новости [ Фото в новостях ] | |

XRP, Maker, Ontology Price Analysis: 09 January
XRP's upward movement stalled at $0.36 resistance but remained above the $0.3 mark as sellers failed to drive prices lower than its present support. MKR's indicators flashed bullish signals as prices The post XRP, Maker, Ontology Price Analysis: 09 January appeared first on AMBCrypto. дальше »
2021-1-9 19:00 | |
|
|
Solana (SOL) Attempts To Break Out Above $2.50 Resistance
Technical indicators and the wave count support the possibility of a breakout that could eventually lead Solana to a high near $5. Solana Bounces Above Support The SOL price has been decreasing since Sept. дальше »
2021-1-7 13:37 | |
|
|
Bitcoin Continues Clawing Its Way Toward $40,000
Despite a lack of weakness from technical indicators, the wave count suggests that Bitcoin is nearing the top of its move, with a possible target near $39,100. Bitcoin Reaches Another All-Time High BTC created yet another bullish candlestick on Jan. дальше »
2021-1-7 11:32 | |
|
|

ETC Makes Fifth Attempt to Break Out Above $7.40
Both technical indicators and the wave count support the possibility of a breakout, which would take ETC to at least $9. 30. Long-Term Resistance ETC has been trading below the $7. 40 resistance area since the rapid decline in March. дальше »
2021-1-6 17:47 | |
|
|
SXP Risks Falling to All-Time Low, Will It Bounce?
However, technical indicators are bullish, suggesting that SXP will break out instead. Long-Term Resistance Line SXP has been decreasing rapidly since reaching a high of $5. 14 on Aug. 14. The fall has been swift, and SXP has been following a descending resistance line since Sept. дальше »
2021-1-6 21:30 | |
|
|
Band Protocol (BAND) Gears Up for Sixth Breakout Attempt
However, the price movement and readings from indicators are bullish, suggesting that Band Protocol will be successful in breaking out. Band Protocol Fails to Move Above Resistance BAND has been facing resistance from the $7. дальше »
2021-1-6 14:24 | |
|
|
Low Circulation and High Demand at Opening of SCU Trading
PRESS RELEASE. Securypto trade will open on Bilaxy on 1 January, 2021 and all indicators say that it will start off strong given the high demand for it alongside the low circulation of the coin as pointed out by Securypto team. дальше »
2021-1-1 20:00 | |
|
|
BAL’s Breakout Could Pave the Way for Higher Prices
The breakout from the former is significant, and when coupled with the bullish readings from technical indicators, it suggests that an upward move is likely. Long-Term Levels The daily chart shows that BAL had been following a descending resistance line since Sept. дальше »
2020-12-29 21:49 | |
|
|
Synthetix (SNX) Reaches New All-Time High – What’s Next?
Indicators and the wave count suggest that SNX will hold this support and gradually begin moving upwards towards yet another all-time high price. All-Time High SNX had been moving downwards since reaching an all-time high of $7. дальше »
2020-12-29 18:17 | |
|
|
0x (ZRX) Finds Relief Above Crucial Support
Despite ambiguity from technical indicators, 0x is expected to increase to the closest resistance area at $0. 425 and could possibly move higher after. 0x Long-Term Support Levels ZRX has been moving downwards since it reached a high of $0. дальше »
2020-12-29 13:27 | |
|
|
Bitcoin: What does Coinbase's 24,000 BTC outflow mean?
Bitcoin's market has seen a confluence of bullish indicators lately, as explained in a previous article. These indicators are extremely bullish for Bitcoin, be it from a retail perspective or institutThe post Bitcoin: What does Coinbase's 24,000 BTC outflow mean? appeared first on AMBCrypto. дальше »
2020-12-24 18:30 | |
|
|
Bitcoin Creates Double Top After Second Failed Attempt at $24,000
However, technical indicators are not all that bearish. Bitcoin is expected to reverse its trend at one of the support levels examined below. Bitcoin Trend Weakens Slightly Yesterday, the BTC price reached a high of $24,100 in another attempt at reaching a new all-time high. дальше »
2020-12-24 10:27 | |
|
|
Ethereum Classic (ETC) Struggles to Overcome $7.50 Resistance
The price action and a variety of technical indicators suggest that ETC will be successful in breaking out. Ethereum Classic Long-Term Support Levels ETC has been following an ascending support line since November 2018 and has validated it four times since. дальше »
2020-12-21 13:21 | |
|
|
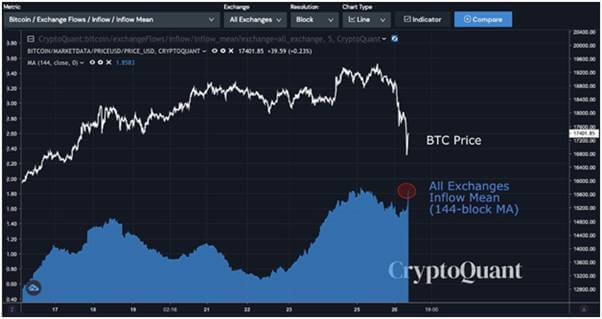
CEO CryptoQuant: Институционалы скупают биткоин
Крупные игроки по-прежнему скупают биткоин даже несмотря на преодоление максимума 2017 года. К такому выводу пришел глава аналитического ресурса CryptoQuant Ки Ён Джу у себя на странице в Twitter. We never know the OTC transaction volume under the hood by institutional investors, but there are on-chain indicators to estimate OTC deals. дальше »
2020-12-21 12:41 | |
|
|
Bitcoin OTC Indicators Point to Ongoing Institutional Buying, And This Means Only One Thing
Bitcoin is holding firmly to its gains made during the wild rally of 4Q20. Trading above $24,000, yes, another all-time high on the weekend, with $4. 7 billion in ‘real’ volume, BTC/USD is up 230% this year. дальше »
2020-12-20 17:31 | |
|
|
Bitcoin Key Indicators Suggest A Strengthening Case For Rally To $25K
Bitcoin price extended its rise and traded above $24,000 against the US Dollar. BTC is currently correcting lower and it could find a strong support near $23,000 or $22,780. Bitcoin rallied further and it traded to a new all-time high above the $24,000 level. дальше »
2020-12-20 07:28 | |
|
|
What Does BTCD Say About Another Altseason?
Technical indicators are bullish and support the possibility of a breakout. BTCD’s Long-Term Resistance BTCD is currently trading above a long-term resistance line that has been in place since Sept 2019. дальше »
2020-12-18 21:55 | |
|
|
Bitcoin Continues Wrestling with Stubborn $19,450 Resistance
While long-term indicators are bullish, lower time-frames have begun to show weakness, suggesting that a short-term drop could occur before Bitcoin moves upwards and breaks out. Bitcoin Attempts Breakout On Dec. дальше »
2020-12-16 11:36 | |
|
|

Five Bitcoin indicators strongly signal BTC landing above $200,000
Bitcoin has been predicted to go bullish in the long run, as short-term obstacles overthrowing the anticipated bull run for a later time (next year, according to numerous analytic predictions), have taken up space in the market. дальше »
2020-12-15 22:10 | |
|
|

Chainlink Price Aiming For Mammoth 35% Move According To These Indicators
Chainlink has been one of the best performing cryptocurrencies in 2020 after the overall market crash in March, the digital asset managed to not only recover but establish a new all-time high at $20, after a colossal 1,500% rally. дальше »
2020-12-12 20:37 | |
|
|
Glassnode: Шесть метрик указывают на рост биткоина выше $200 000
Цена биткоина может вырасти в десять раз от текущих уровней. К такому выводу пришел технический директор Glassnode Рафаэль Шульце-Крафт на основе шести ончейн-метрик. 1/ Where are we in the #Bitcoin market cycle? A look at some of the most important on-chain market indicators. дальше »
2020-12-11 14:06 | |
|
|

Glassnode: «безумно бычьи» метрики биткоина указывают на цели выше $200 000
Цена биткоина может вырасти в десять раз от текущих уровней. К такому выводу пришел технический директор Glassnode Рафаэль Шульце-Крафт на основе шести ончейн-метрик. 1/ Where are we in the #Bitcoin market cycle? A look at some of the most important on-chain market indicators. дальше »
2020-12-11 12:24 | |
|
|
WAVES Drops Shortly After Reaching New Yearly High
Technical indicators and the wave count suggest that this is the most likely possibility. WAVES Reaches New Yearly High The WAVES price has been increasing alongside a parabolic ascending support line since the beginning of Oct. дальше »
2020-12-10 18:05 | |
|
|
Binance Coin (BNB) Finds Support After Rejection from $32
Indicators have turned bearish and Binance Coin is expected to complete another drop towards support targets before possibly moving upwards once again. BNB Long-Term Double Top The BNB price has been moving upwards since reaching a low of $6. дальше »
2020-12-10 12:54 | |
|
|
TOMO Fails to Break Out Again, What’s Next?
Technical indicators are bearish, suggesting that another drop towards the support area outlined below is likely before the price makes another breakout attempt. TOMO Attempts to Break Out TOMO has been following a descending resistance line since it reached a high of $1. дальше »
2020-12-10 20:04 | |
|
|
Litecoin Price Analysis - Continued bullish technical indicators
Technicals for the LTC/USD pair reveal bullish trend metrics with the spot price above both the 200-day EMA and daily Cloud. The most significant upside resistance sits at US$70 based on the yearly pivot and VPVR. дальше »
2020-12-10 14:01 | |
|
|

Bitcoin “Double Top” Narrative Builds, Factors To Potentially Fear
Bitcoin price is in a precarious location. The asset set a new all-time high just days ago but is trading below the record and starting to decline. The shifting momentum is now presenting in technical indicators supplying bearish signals, adding to the double top narrative that’s been building since failing to break $20,000. Here are […] дальше »
2020-12-9 23:00 | |
|
|
OCEAN Breaks Down and Struggles to Maintain Support
While OCEAN is trading just above a minor support area, technical indicators suggest that it will break down and head towards the support areas outlined in the article. OCEAN Breakdown From Support The OCEAN price had been following an ascending support line since reaching a low of $0. дальше »
2020-12-8 22:33 | |
|
|
Bitcoin Price Slides $500 Overnight, But Is A Steeper Selloff Brewing?
Bitcoin price is now trading under $19,000, after repeated failure to sustain above its former all-time high and flip the former record from resistance to support. Since then, the leading cryptocurrency by market cap has fallen $500, but it could be the beginning of a short bearish phase to reset market sentiment, indicators, and more, […] дальше »
2020-12-8 17:07 | |
|
|

Key Bitcoin futures metrics show traders are bullish despite flat BTC price
Multiple indicators show pro and retail traders remain strongly bullish even as Bitcoin price failed to break $20,000.
дальше »2020-12-9 00:15 | |
|
|

Ten Different Bearish Divergences Stack Against Bitcoin, But Drop Has Yet To Arrive
Bitcoin has been unstoppable from Q2 2020 on, bringing the asset to a new all-time high and restoring interest and bullish momentum in the cryptocurrency market. But as the most dominant crypto asset in the space continues to climb with very few corrections in between, ten of the most widely used technical indicators are now […] дальше »
2020-12-3 23:00 | |
|
|
Cardano Price Analysis - Fundamental indicators on the rise
On-chain fundamentals indicators have increased and decreased dramatically over the past few months, along with the rise and fall in token price. дальше »
2020-12-2 14:01 | |
|
|
From FOMO To Overbought: Why Bitcoin Is Overdue For A Steep Correction
FOMO has returned to the crypto market in a major way, now that Bitcoin has set a new all-time high price record. But as more buyers pile in after an already nearly 200% rally in 2020, indicators are reaching extreme readings of overbought conditions, that nearly every time in the past has resulted in a […] дальше »
2020-12-2 04:00 | |
|
|
VeChain (VET) Bounces Up and Aims for Nearest Resistance
Despite the corrective short-term pattern that VeChain has been trading in, technical indicators are bullish and support the possibility that the upward movement will continue. VeChain Re-Tests Support The VET price has been moving upwards since Nov. дальше »
2020-12-1 15:09 | |
|
|
DASH Price Analysis - USD market flips bullish
Technical indicators for the DASH/USD market pair have flipped from bearish to bullish over the past few days. The current spot price is now above both the 200-day EMA and daily Cloud. дальше »
2020-12-1 14:01 | |
|
|

4 key indicators reflect extreme optimism from pro Bitcoin traders
Key derivatives indicators show pro traders remain strongly bullish even as Bitcoin price continues to reject at $19,800.
дальше »2020-12-1 03:58 | |
|
|
The Ripple Effect: 5 Key Factors Behind The 100% XRP Surge
After spending three years of the crypto bear market as the butt of all jokes, being compared to sheep manure, and much more, XRP has shocked the entire industry with a 225% single-month explosion. But the powerful breakout could only be just beginning, according to a variety of technical indicators that measure the strength of […] дальше »
2020-11-25 23:00 | |
|
|

Another significant bullish market trend that could catapult Bitcoin’s price to new highs
Technical indicators may suggest that Bitcoin is currently staggering between gains and losses, but fundamental patterns are suggesting otherwise. The new fundamental signal according to Glassnode’s report implies that selling pressure is reducing drastically. дальше »
2020-11-24 23:03 | |
|
|
CME Group Volatility Indexes (CVOL) – FAQ
Table of contents What are the CME Group Volatility (CVOL) Indexes? How do the CVOL Indexes work? What is the calculation methodology for CVOL Indexes? What is simple variance? What are the additional indicators that are calculated? What is UpVar? What is DnVar? What is Skew? Which CME Group products will have their own CVOL Index and indicators? What time of day are CVOL Indexes available? When will CVOL Indexes be offered as real-time indexes? Are CVOL Indexes IOSCO-compliant benchmarks? What kind of oversight applies to CVOL Indexes? Where can I find additional information about CVOL Indexes? How can I access the index data? Where can I find technical details surrounding the CVOL calculation methodology? Will CVOL Indexes be available for licensing? Can I receive this data through a third party like Bloomberg and Refinitiv or do I need to get it from CME Group directly? дальше »
2020-11-20 01:01 | |
|
|
