Chart - Свежие новости [ Фото в новостях ] | |

TRON PRICE ANALYSIS & PREDICTION (March 13) – TRX Undergoes Retracement: Targets This Key Trendline For Rebound
Amidst the latest increase across the crypto space, Tron TRX took a bow and continued to retrace downward on the daily chart. It currently appears weak but the trend remains bullish from a long-term perspective. дальше »
2024-3-14 00:16 | |
|
|
LTC/USDT technical analysis: potential long opportunity as the price continues the rally
LTC/USDT chart and technical analysis Litecoin is in a bullish trend on smaller timeframes and the price is making higher highs for the last couple of months. The price gained more than 22% since the start of the current week and the price will likely make a correction after the recent surge. The price may […] дальше »
2024-3-14 18:21 | |
|
|
WIF's rise to $3 might be delayed, here's why
WIF maintained a bullish market structure on the 4-hour chart. A minor dip could be followed by a sustained rally. Popular meme coin dogwifhat [WIF] has climbed to become the fifth-largest mThe post WIF's rise to $3 might be delayed, here's why appeared first on AMBCrypto. дальше »
2024-3-12 23:30 | |
|
|
BITCOIN PRICE ANALYSIS & PREDICTION (March 11) – BTC Successfully Flips $71k With A 10% daily Surge, Where Is It Heading Next?
Bitcoin’s volume increased today after a failed attempt to break higher last weekend. Its parabolic movement remains valid on the daily chart but it seems to be nearing an overbought region on the short-term perspective. дальше »
2024-3-11 16:41 | |
|
|
Ripple (XRP) Forecasted to Hit $17: Here’s When
XRP, the native token of the Ripple blockchain, is poised for significant price appreciation in the coming months, according to a recent analysis. The analyst, who prefers not to engage in precise market timing, has nonetheless ventured to provide two potential price targets based on ascending triangle chart patterns. дальше »
2024-3-11 11:52 | |
|
|
FLOKI PRICE ANALYSIS & PREDICTION (March 9) – Floki Breaks Higher After Exploding 40% Overnight, Where Next?
Meme coins are gaining traction again after taking a short break in buying. Floki saw the most gain today, leading the top-gainer chart with a 210% surge in the past week. Failure to sustain momentum may result in a reversal. дальше »
2024-3-10 12:00 | |
|
|
NEAR/USDT potential long opportunity as the price drops for correction
NEAR/USDT chart and technical analysis The NEAR protocol gained 72% this week and the price broke above the previous high of 4. 77. Currently, the price is making a correction and will likely retrace back to the 4. дальше »
2024-3-9 18:29 | |
|
|
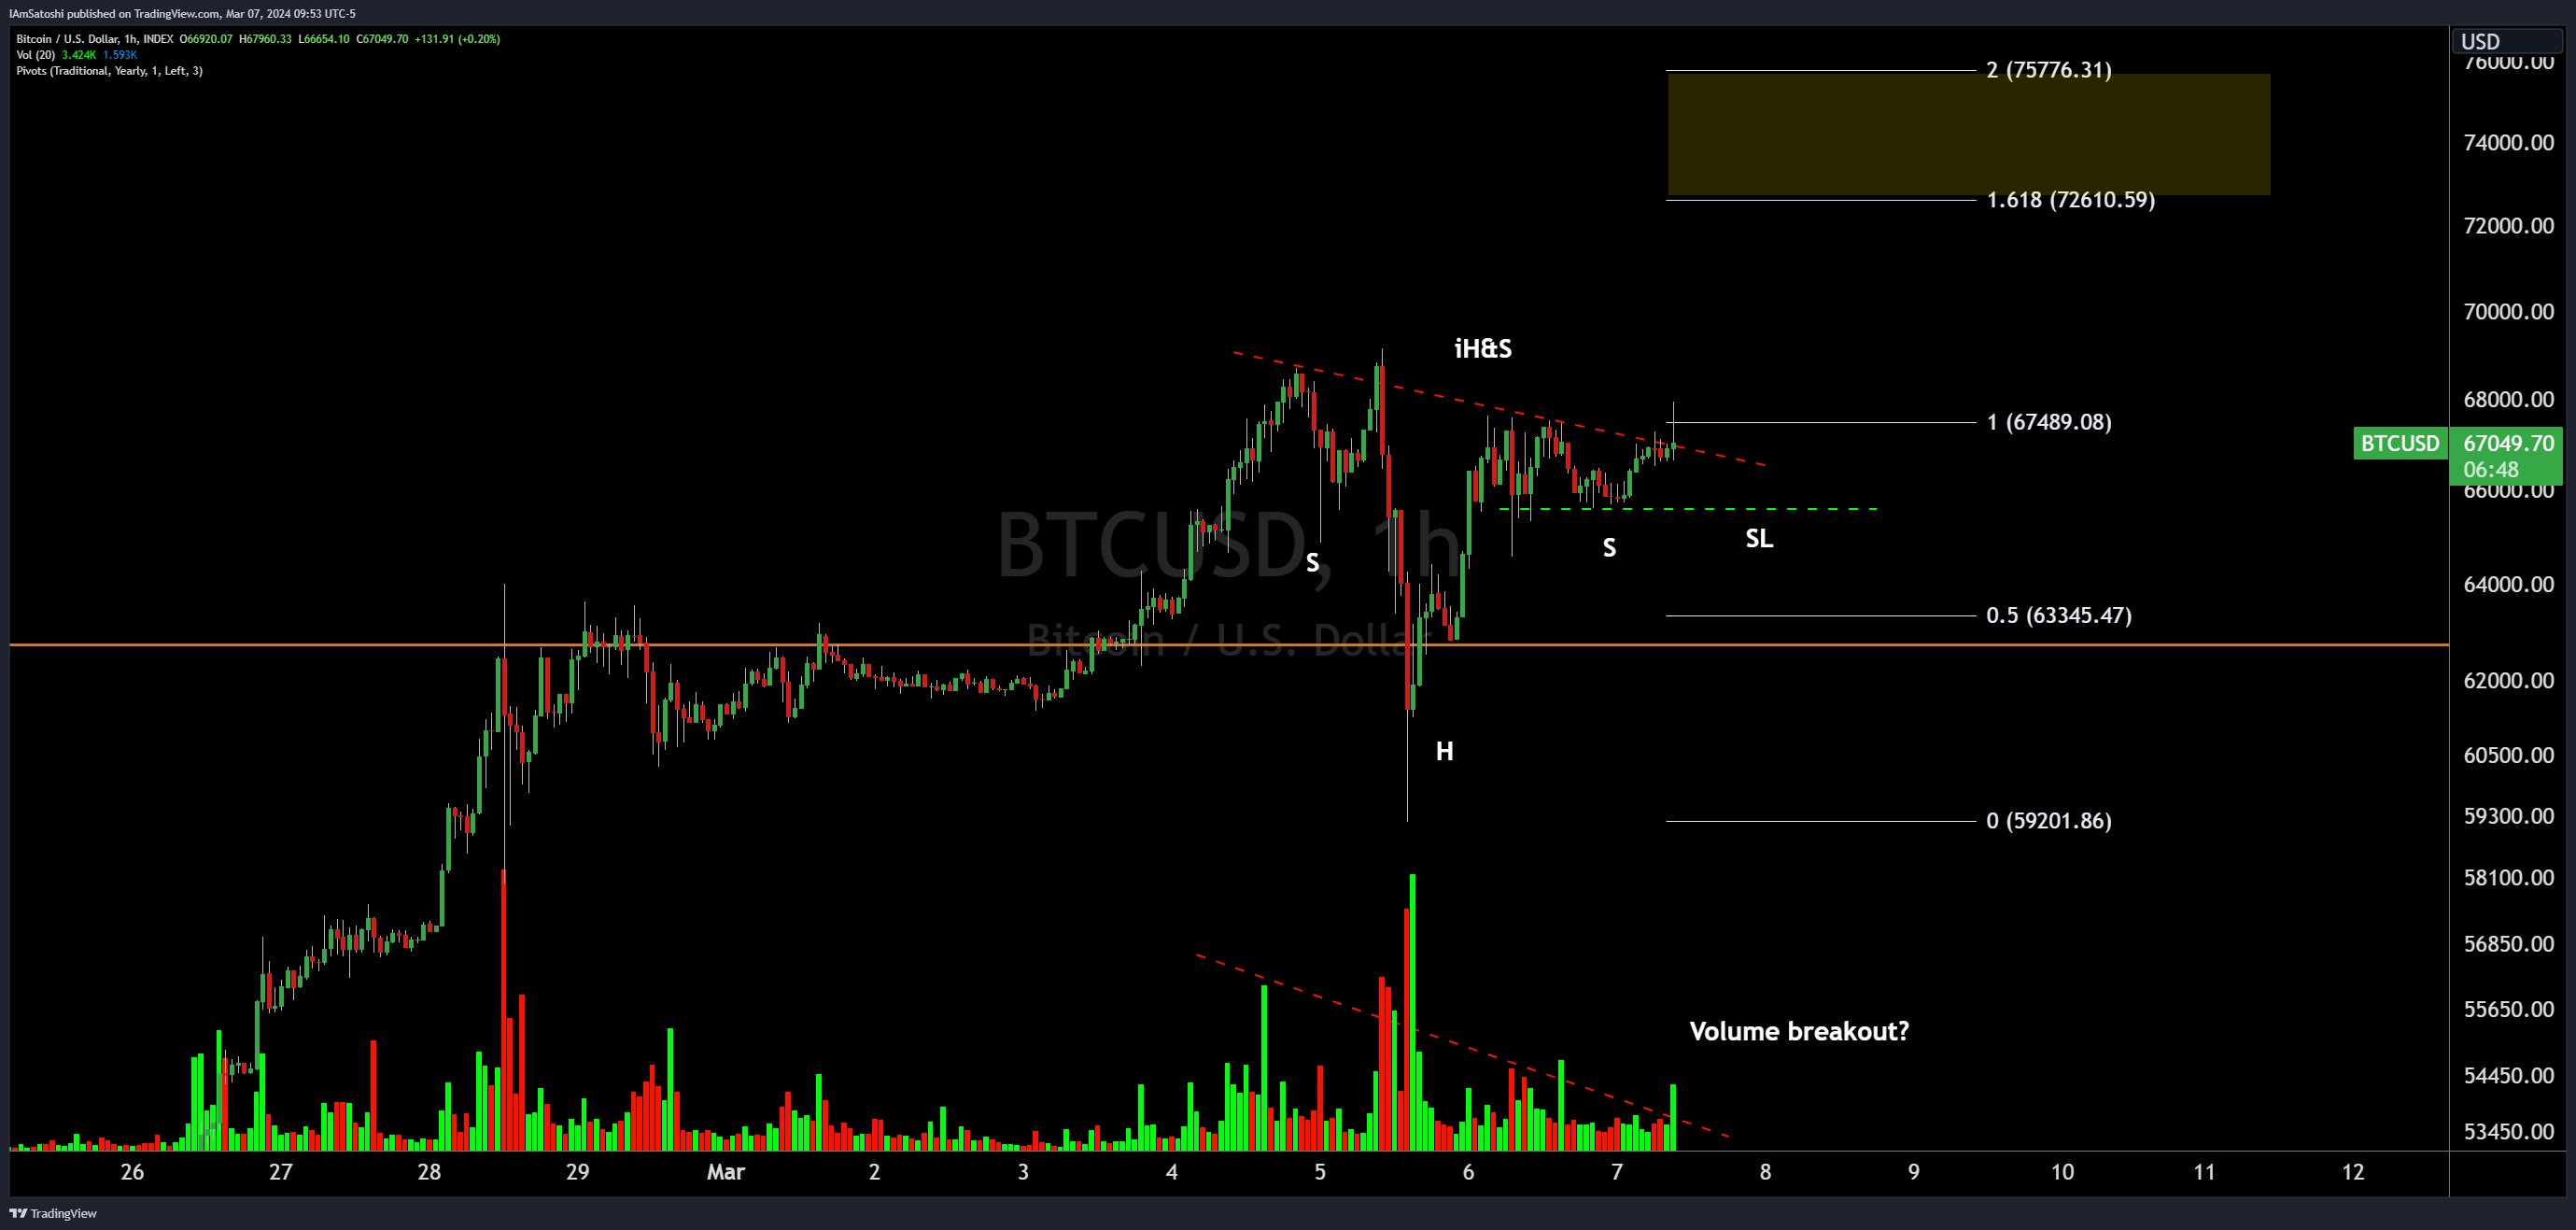
Bitcoin Price Forms Inverse Head And Shoulders Pattern, Eyes $76,000
Just below the all-time high of $69,000, the Bitcoin price has shown more volatility in recent days, only to now tread water around $67,000. But this boredom could soon be over. Following the recent price movements, a notable pattern has emerged on the Bitcoin (BTC) price chart, as recognized by the seasoned crypto analyst Josh Olszewicz. дальше »
2024-3-8 11:30 | |
|
|
SOLANA PRICE ANALYSIS & PREDICTION (March 8) – Sol Confirms Next Leg Up With A Break, Expect Big Moves Soon
After witnessing a sudden crash a few days ago, Sol saw an unprecedented surge in volume in the last two weeks. The price is up 10% in the last 24 hours, ready for a huge price movement on the daily chart. дальше »
2024-3-8 09:37 | |
|
|
AI tokens dominate the top gainers’ chart, FET leads the batch
Big data and artificial intelligence (AI) tokens have gained momentum as investors shift focus to altcoins amid bullish market sentiment. According to data provided by CoinMarketCap (CMC), the top five gainers among the leading 100 cryptocurrencies are from the big… дальше »
2024-3-7 11:18 | |
|
|
Tronix potential short setup as the price drops below a key support level
TRX/USDT chart and technical analysis TRX/USDT yesterday dropped below the key support of 0. 1375 and closed below this level. The recent drop was mainly driven by the massive sell-off after the BTC/USD reached an all-time high. дальше »
2024-3-6 14:29 | |
|
|
XRP to break out of a bull pattern - Here's why it should interest you
XRP’s daily chart was red at a time when its price was exiting a symmetrical triangle pattern. Market indicators remained bearish on the token. The bullish market condition has turned thThe post XRP to break out of a bull pattern - Here's why it should interest you appeared first on AMBCrypto. дальше »
2024-3-6 06:30 | |
|
|
$1.3+ Trillion: Bitcoin Market Cap Sets New Record All-Time High
Considering the seemingly unstoppable momentum in Bitcoin price action, a new all-time high on the BTCUSD trading pair is less than 2% away. Meanwhile, due to the supply of new BTC unlocked since 2021, the BTC market cap chart has reached a new all-time high above $1. дальше »
2024-3-5 01:54 | |
|
|
Эксперт предсказал биткоин по $10,6 млн к 2045 году
В ближайшие 15 лет биткоин может подорожать в 64 раза, до $10,63 млн. Такой прогноз дал бывший профессор физики Джованни Сэнтостази, основываясь на модели степенной зависимости. First cut from my 90 min deep dive with @Giovann35084111 This is the chart that you "can't unsee". дальше »
2024-3-4 15:35 | |
|
|
Dogecoin (DOGE) Price Poised to Double? This Indicator Signals Bullish Trend
Dogecoin's price surge hints at a potential doubling, driven by market sentiment and external factors. Bullish indicators, like a golden EMA crossover in the weekly chart and gains against Bitcoin, support this momentum. дальше »
2024-3-4 14:00 | |
|
|
Comparing Solana and Cardano this mini alt-season
The Open Interest behind Cardano revealed an interesting trend. The Tether Dominance chart showed that further gains were likely. Bitcoin [BTC] bulls have applied a lot of pressure in the paThe post Comparing Solana and Cardano this mini alt-season appeared first on AMBCrypto. дальше »
2024-3-4 02:30 | |
|
|
Pepe and VeChain Price Skyrocket, NuggetRush Hits the $2.5M Milestone in Presale
TLDR: Pepe has re-emerged as one of the best altcoins in the market lately, climbing 192. 7% on the weekly price chart. Additionally, VeChain is trading above the 50-day and 200-day SMAs. Meanwhile, NuggetRush has emerged as the best presale on the top ICO list, raising over $2. дальше »
2024-3-2 20:00 | |
|
|

Ethereum classic technical analysis: potential long opportunity as Price surpasses Oct 2022 high
ETC/USDT chart and technical analysis Ethereum Classic is in a bullish trend and the price has recovered almost 38% since the last week. The price also broke the previous high of 32. 46 today and will likely reach 40. дальше »
2024-3-2 18:06 | |
|
|
BONK PRICE ANALYSIS & PREDICTION (February 29) – Bonk Charges Stronger, Aims To Retake Its ATH Following 100% Surge In A Week
Bonk Inu appeared to be gaining traction again after lifting from a key support level. The price looks strongly bullish on the daily chart, making it the current top crypto gainer with 45% gains in the last 24 hours. дальше »
2024-3-1 00:19 | |
|
|
SOLANA PRICE ANALYSIS & PREDICTION (February 29) – Sol Prints New Multi-Month High Following Latest Surge, Where Next?
Following the latest surge in volatility across the space, Solana appeared to be breaking out of its previous resistance. It has tapped a new monthly high and now looks ready for a big price movement on the daily chart. дальше »
2024-3-1 00:13 | |
|
|
Polkadot Going According to Top Analyst’s Prediction; DOT Must Now Close Above This Level for Bullish Continuation
Notable cryptocurrency analyst Rekt Capital (@rektcapital) posted a Polkadot (DOT) price chart analysis on Twitter, stating that price action has followed his prediction perfectly. According to Rekt Capital, Polkadot has rallied over 40% and adhered precisely to the “blue path” laid out in his previous analysis. дальше »
2024-2-29 20:30 | |
|
|
Shiba Inu (SHIB) Price Skyrockets By 28%: 4 Key Reasons
The price of Shiba Inu (SHIB) has surged by 28% in the last 24 hours and 45% in the last seven days. Today’s surge can be attributed to a confluence of factors, including a rekindling meme coin frenzy, actions by crypto whales, a favorable chart setup, and significant partnerships and ecosystem expansions. дальше »
2024-2-29 19:00 | |
|
|
GALA PRICE ANALYSIS & PREDICTION (February 28) – Gala Encounters Resistance After Breakout, Still Up 100% In A Month
Gala reached a multi-month high yesterday following a consistent increase since the start of the month. It saw a rejection and is now looking weak today, although its bullish trajectory remains valid on the daily chart. дальше »
2024-2-29 00:42 | |
|
|
Toncoin is on its way to an all-time high amidst the Telegram advertising platform launch
TON/USDT chart and technical analysis Toncoin made a significant rally today and gained more than 37% in the last couple of hours. The price has been in a ranging market since the last month however, it broke the ranging market today. дальше »
2024-2-29 18:12 | |
|
|
APECOIN PRICE ANALYSIS & PREDICTION (February 27) – Ape Rejects $2 After Breakout, Can It Sustain Buying Pressure?
Apecoin just broke out to a six-month resistance following a steady rise since the start of the month. It has rejected the $2 level but still sits above key support, forming a bullish pattern on the daily chart. дальше »
2024-2-29 20:36 | |
|
|
Bitcoin could rally once more - Watch out for this on USDT's chart
The stablecoin supply ratio hinted at a bearish sentiment. The Tether Dominance chart could be useful for determining BTC's local top Bitcoin [BTC] formed a range after crossing the $50k thrThe post Bitcoin could rally once more - Watch out for this on USDT's chart appeared first on AMBCrypto. дальше »
2024-2-27 09:30 | |
|
|
DeFi tokens UNI, AAVE, MKR gain, but the trends are changing
AAVE’s price surged by 4% in the last seven days. UNI’s daily chart turned red as its value plummeted by over 13%. During the last few weeks, AI tokens created a buzz in the crypto spaThe post DeFi tokens UNI, AAVE, MKR gain, but the trends are changing appeared first on AMBCrypto. дальше »
2024-2-25 11:30 | |
|
|
FIL breaks above early January highs - Is a move to $10 next?
Filecoin has a strong bullish bias on the daily chart. The possibility of a reversal and range formation was present. Filecoin [FIL] saw a stellar performance in the past three weeks. It retThe post FIL breaks above early January highs - Is a move to $10 next? appeared first on AMBCrypto. дальше »
2024-2-25 21:30 | |
|
|
AVALANCHE PRICE ANALYSIS & PREDICTION (February 24) – Avax Signals Another Sell-off After A Month’s Recovery, Is $24 The Next Target?
Avax is down 11% weekly after failing to sustain recovery above the $44 level. It is forming a bearish pattern on the weekly chart and may continue to lose momentum until it reaches an exhaustion point. дальше »
2024-2-24 09:01 | |
|
|
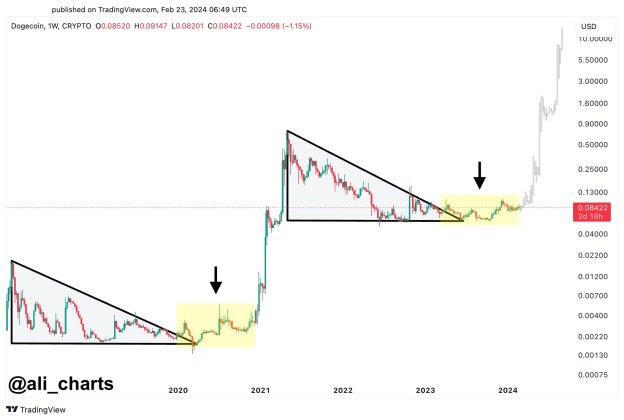
Dogecoin Patterns That Led To 28,000% Rally In 2020 Have Returned
Dogecoin is once again on the radar of crypto investors after multiple important patterns have made their way to the fore. This was pointed out by crypto analyst Ali Martinez, who identified multiple patterns similar to what was seen in 2020 that could result in a parabolic rally. дальше »
2024-2-24 01:00 | |
|
|
As Bitcoin (BTC) Charges On, This AVAX Metric May Signal Price Dips for Altcoins – But There’s a Catch
Cryptocurrency analyst Altcoin Sherpa warned regarding the potential for heavy capitulation across the altcoin market if key support levels fail. AVAX Chart Signals Broad Market Troubles In a tweet post, he highlighted Avalanche’s AVAX token as an important chart to monitor, cautioning that a decisive breakdown could spark a crisis of confidence rippling across cryptos […] The post As Bitcoin (BTC) Charges On, This AVAX Metric May Signal Price Dips for Altcoins – But There’s a Catch appeared first on CaptainAltcoin. дальше »
2024-2-24 23:30 | |
|
|
Top Analyst Reveals PEPE Price Levels to Watch as Bulls Target Over 100% Spike
Popular crypto analyst Ali (@ali_charts) has revealed key price levels to watch for PEPE, as bulls target over a 100% price spike from current levels. Technical Analysis Supports Upside for PEPE According to Ali, PEPE is showing signs of forming the right shoulder of a head-and-shoulders bottoming pattern on its 3-day chart. дальше »
2024-2-24 22:30 | |
|
|
DeeStream (DST)’s Potential Could Take on Pyth Network (PYTH) and Cardano (ADA) in Battle for Chart Supremacy
As DeeStream (DST) emerges as a contender for chart supremacy, its potential to rival Pyth Network (PYTH) and Cardano (ADA) garners attention. Priced at just $0. 035, its promise of locked liquidity for life offers security to investors. дальше »
2024-2-23 00:00 | |
|
|
Ripple Analyst Predicts $5.85 XRP as Next Target in Ongoing Bull Run – But There’s a Catch
XRP price has remained relatively flat this week, down a modest 1% to trade around $0. 54. Technical analysis shows that XRP recently broke out of a descending channel it had been stuck in since late November, marked by the blue lines on the price chart. дальше »
2024-2-23 21:00 | |
|
|
BNB/USD long opportunity amid ranging market breakout
BNB/USD chart and technical analysis The price of Binance coin broke the ranging market recently and closed above the previous high of $366. This could mark the beginning of another bullish wave for BNB/USD and the price is likely to gain another 15-20% in the coming rally. I am expecting the price will make a […] дальше »
2024-2-21 17:43 | |
|
|
Solana Shows Imminent Breakout from Inverted Head and Shoulders Pattern; Analyst Predicts SOL Could Reach As High As This Level
Analyzing the SOL daily chart, Coinpedia spotlights the formation of a clear inverted head and shoulders pattern, typically signaling the end of a downtrend. SOL looks set to break above the neckline resistance around $115, which projects an ambitious upside target of $150 if historical precedents hold. дальше »
2024-2-19 12:30 | |
|
|
Polkadot (DOT) Bulls Must Defend Key Support Level For Price Recovery, Analyst Warns
Tony Bitcoin, a crypto analyst, warns that Polkadot’s DOT token must hold a key ascending support line to avoid further losses. According to Tony’s chart, DOT has repeatedly bounced off this ascending support over the past few months. дальше »
2024-2-18 13:30 | |
|
|
Polygon’s MATIC Nears Critical 3-Year Resistance Level: A Make-or-Break Point for Its Next Major Direction
Crypto Rover, a crypto trader, predicts that MATIC is about to break out of a 3-year consolidation phase. According to Crypto Rover’s chart, the price has hit resistance three times in the past and is now approaching a fourth touch. дальше »
2024-2-18 12:40 | |
|
|
FLOKI PRICE ANALYSIS & PREDICTION (February 17) – Floki Nears Key Resistance Following An Impressive Recovery In Two Weeks, What’s Next?
Amid the latest surge in volatility, Floki increased by 15% in the past week and now looks bullish on the daily chart. It currently trades near a monthly resistance level as it gathers momentum for a massive move. дальше »
2024-2-18 16:13 | |
|
|
SingularityNET’s AGIX Surges as Cup and Handle Pattern Breaks: How High Can the Price Go in This Move?
Cryptocurrency analyst CryptoBull_360 tweeted that AI token SingularityNET (AGIX) is breaking out from a bullish cup and handle pattern on the daily chart. This technical pattern involves a U-shaped “cup” consolidation followed by a smaller “handle” consolidation before a major breakout. дальше »
2024-2-16 17:12 | |
|
|
XRP Price Alert: Breakout Could Confirm Today
The XRP price has been in a downtrend since mid-November 2023. However, the XRP bulls seem to be taking control again if the following happens. An analysis of the 1-day chart of XRP/USD reveals that a potential price breakout is imminent. дальше »
2024-2-15 19:00 | |
|
|