Chart - Свежие новости [ Фото в новостях ] | |

Hedera Hashgraph price could soar as HBAR forms a bullish pattern
Hedera Hashgraph price has stabilized, and a unique chart pattern on the daily chart suggests a potential rebound. Hedera Hashgraph (HBAR) has risen for two consecutive days, reaching a high of $0.3140, its highest level since January 7. The token… дальше »
2025-1-15 16:36 | |
|
|
Why Bitcoin could shock traders with drop to $70,000, a deep dive
Bitcoin (BTC) trades above $96,000 on Tuesday, January 14. The largest cryptocurrency has recovered from a flash crash under $90,000 and macroeconomic headwinds last week. Large scale profit-taking could push BTC to the support zones on the weekly chart, close to the $70,000 level. дальше »
2025-1-15 15:00 | |
|
|
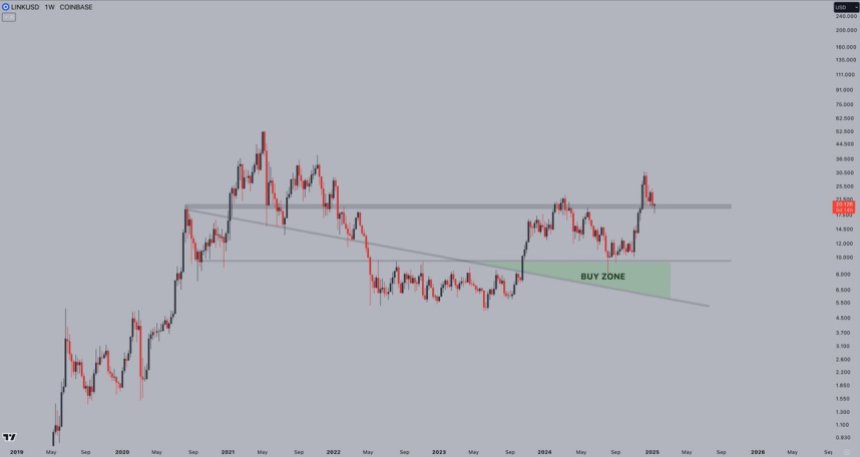
Chainlink Weekly Chart Looks Promising – If Bulls Reclaim $30 ‘ATH Are Next’
Chainlink has showcased its volatility over the past few days, with the price plunging 12% before staging an impressive 13% recovery in less than 24 hours. This rapid rebound has sparked optimism among investors, who view the altcoin’s resilience as a sign of its potential for significant gains in the near term. дальше »
2025-1-14 21:30 | |
|
|
Mapping Dogecoin's price targets after memecoin market cap falls below $100B
Heightened Dogecoin circulation and lowered volatility highlighted HODL behavior Price action chart outlined $0.316 as a vital short-term support At the time of writing, Dogecoin [DOGE] was The post Mapping Dogecoin's price targets after memecoin market cap falls below $100B appeared first on AMBCrypto. дальше »
2025-1-13 12:00 | |
|
|
Micheal Saylor hints at another Bitcoin purchase as holdings reach 447,470 BTC
Michael Saylor, executive and former MicroStrategy CEO, hinted at another Bitcoin purchase via a cryptic tweet. Saylor posted a screenshot referencing the “next green dot” on the Saylortracker chart, where each dot represents a Bitcoin (BTC) acquisition. The suggestion comes… дальше »
2025-1-13 23:39 | |
|
|
Solana Chart Breakdown: Prepare for SOL’s Next Big Price Move!
The Solana price lost around 10% of value during the recent market downturn, which is similar to plunges seen in DOGE or Ethereum. Popular crypto analyst Ali Martinez posted a viral Solana chart today, sharing insights on potential SOL price movements ahead. дальше »
2025-1-13 22:00 | |
|
|
SUI PRICE ANALYSIS & PREDICTION (January 12) – SUI Bulls Continues to Thrive Amid Market Setbacks, Increases 10% Today
Amid all odds, SUI maintained a bullish rally and continued to show signs of strength weekly. Locating support after a short pullback, it is footing a fresh increase on the daily chart and now looks set for a breakup. дальше »
2025-1-13 18:53 | |
|
|
Fantom's sell-off escalates with 52% losses - Are more incoming?
Fantom seemed to have a strongly bearish structure on the daily chart OBV slipped below November lows while the next downward price target was at $0.5 At the time of writing, Fantom [FTM], sThe post Fantom's sell-off escalates with 52% losses - Are more incoming? appeared first on AMBCrypto. дальше »
2025-1-12 18:00 | |
|
|
Curve Finance network activity doubles in 2024 - Will it fuel CRV value in 2025?
Curve Finance's user base doubled in 2024 Will CRV reverse its recent losses on the price chart amid strong network growth? Curve Finance’s user base more than doubled in 2024, reinforThe post Curve Finance network activity doubles in 2024 - Will it fuel CRV value in 2025? appeared first on AMBCrypto. дальше »
2025-1-11 10:00 | |
|
|
How High Could Decentraland (MANA) Price Spike in 2025?
The price of MANA has declined by more than 40% in the last 5 weeks. It is currently consolidating on the daily chart with not many signs of a bullish rally. But can the MANA token rise in 2025? And how high can it spike? YouTube channel, Cheeky Crypto took a deep dive into Decentraland’s […] The post How High Could Decentraland (MANA) Price Spike in 2025? appeared first on CaptainAltcoin. дальше »
2025-1-11 01:21 | |
|
|
Stellar Price Consolidates: Analysis Highlights Key Trends and Levels for XLM’s Next Move
Stellar (XLM) is showing signs of an imminent breakout despite its ongoing consolidation phase. An analysis of the daily chart on TradingView indicates mounting pressure for a decisive price move. дальше »
2025-1-10 16:30 | |
|
|

Chart Similarity Between Cardano’s 2021 Rally and DTX Exchange Triggers ADA Whale to Pump $760K in Viral Presale
Cardano’s legendary 2021 rally set the benchmark for what a breakout blockchain project can achieve. From innovation to massive returns, ADA reshaped how investors view long-term crypto potential. Now, history is echoing as whales shift focus, this time with a $760K bet on DTX Exchange’s viral presale. дальше »
2025-1-10 16:23 | |
|
|
Indicator Signals Bullish Rebound for Bitcoin (BTC) Price, But Key Support Must Hold Firs
A technical signal suggests Bitcoin could be preparing for an upward move, according to crypto analyst Ali. However, the success of this potential rally hinges on a crucial support level. TD Sequential Points to Possible BTC Price Reversal The TD Sequential indicator on Bitcoin’s 4-hour chart has flashed a buy signal, as observed by Ali […] The post Indicator Signals Bullish Rebound for Bitcoin (BTC) Price, But Key Support Must Hold Firs appeared first on CaptainAltcoin. дальше »
2025-1-9 01:30 | |
|
|
This Chart Pattern Reveals When Dogecoin (DOGE) Final Bull Run Could Start
A chart pattern has emerged in Dogecoin’s price movement, as revealed by Trader Tardigrade. The pattern suggests DOGE might be on the verge of a significant breakout reminiscent of its 2017 performance. дальше »
2025-1-9 00:30 | |
|
|
Why Is Litecoin (LTC) Trending Up? Analyst Hint at Historical Price Movements
Litecoin might be heading up in price. Looking at past patterns, prominent analyst CW shared on X that there’s a good chance the price of LTC will hit specific levels in this market cycle. Over time, Litecoin’s price has moved up and down between two lines on the chart – kind of like a path […] The post Why Is Litecoin (LTC) Trending Up? Analyst Hint at Historical Price Movements appeared first on CaptainAltcoin. дальше »
2025-1-9 20:30 | |
|
|
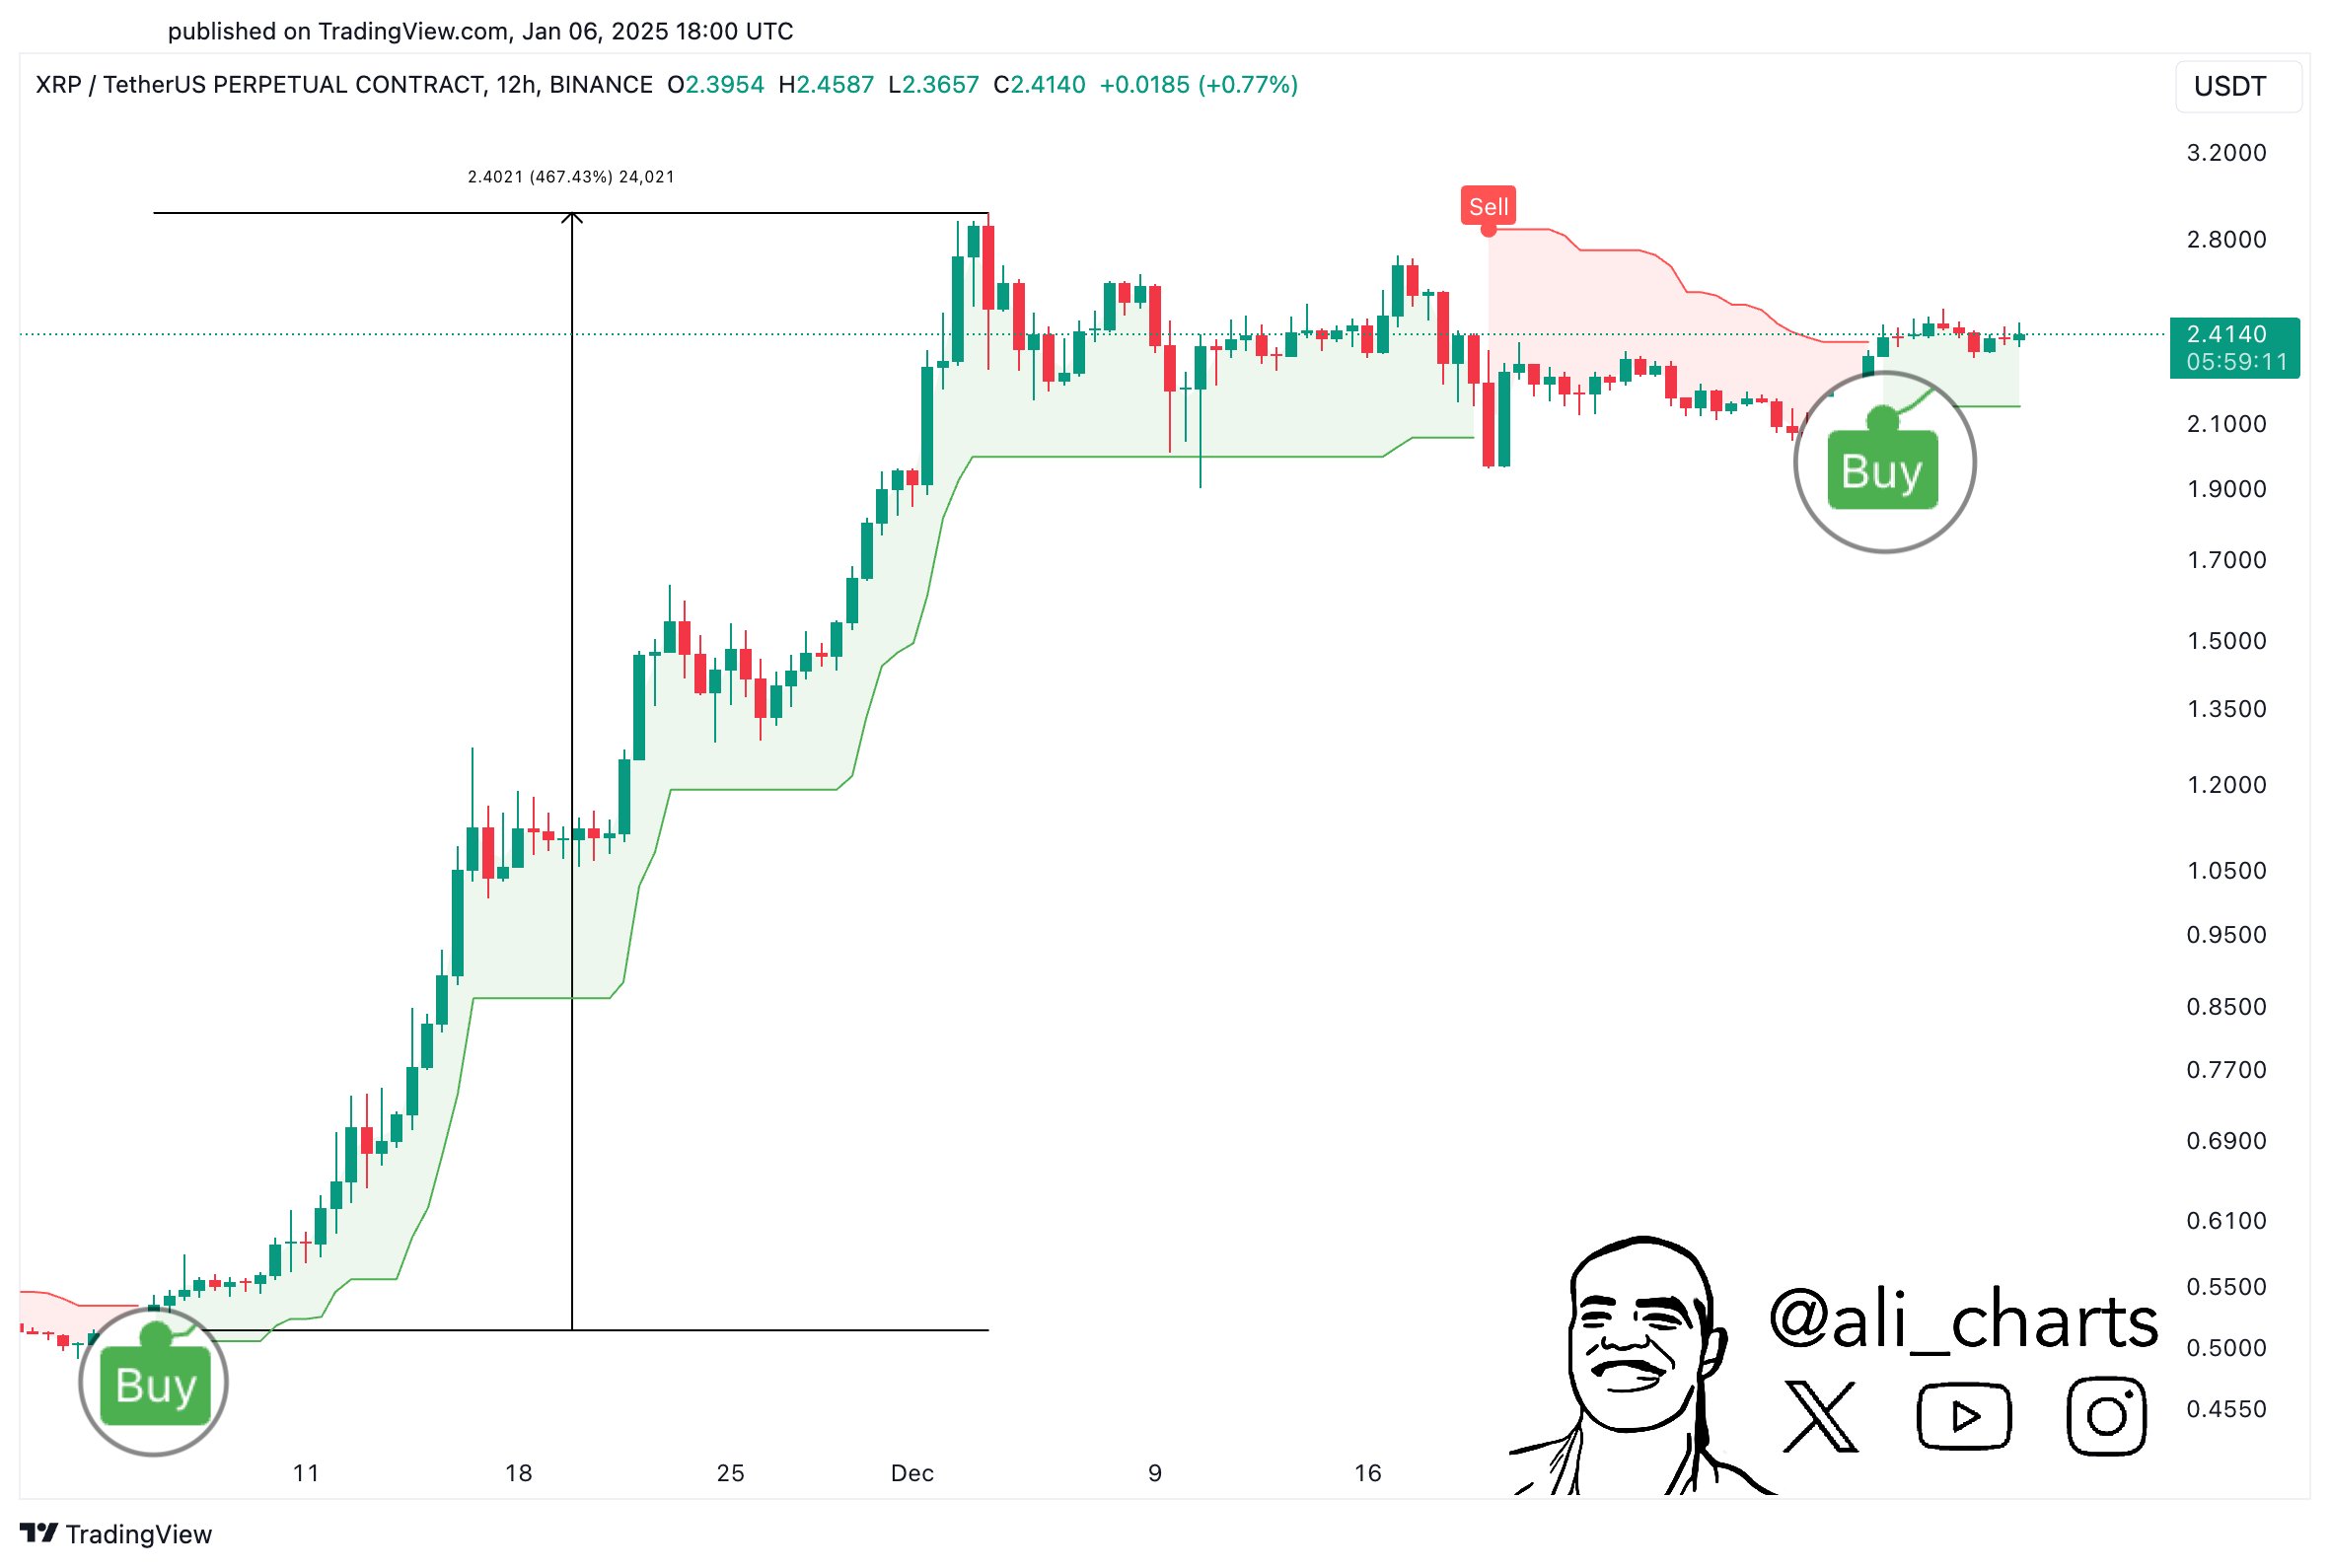
XRP Could Skyrocket 470% If History Repeats, SuperTrend Indicator Suggests
In a technical analysis shared on X, popular crypto analyst Ali Martinez (@ali_charts) has drawn attention to a potentially significant bullish signal for XRP. Martinez highlighted that the SuperTrend indicator, applied to the 12-hour chart of XRP/USDT, has flipped to a bullish orientation—a pattern that preceded a meteoric 470% price surge the last time. дальше »
2025-1-8 19:30 | |
|
|
Expert Predicts Chainlink (LINK) Price Could Rally to $200 Amid Major Partnership With Ripple
Chainlink (LINK) could see a surge in value as per a price prediction lately and a key partnership announcement. Analyst Captain Faibik has projected that LINK could reach $200 during this market cycle based on a technical chart analysis. дальше »
2025-1-7 19:30 | |
|
|
Render forms a strong bullish pattern: here’s the next price target
Render Token ($RENDER) has once again caught the eye of cryptocurrency analysts by forming a notable bullish chart pattern known as the cup and handle. This pattern, identified on the daily chart, has a neckline set at around $10, which is a critical resistance level for the token. дальше »
2025-1-7 19:02 | |
|
|
XRP could rally 262% - What's behind Peter Brandt’s prediction?
Peter Brandt projected that XRP’s market cap could soar to $500B. Selling pressure on exchanges has remained low, signaling the expectation of a rally. Veteran price chart analyst and The post XRP could rally 262% - What's behind Peter Brandt’s prediction? appeared first on AMBCrypto. дальше »
2025-1-7 12:00 | |
|
|
50x altcoin rally incoming: Intel Markets could repeat SOL’s 2021 chart pattern
Some analysts claim that Intel Markets is replicating the SOL price trajectory and is ready to become the next Solana of this bull run as a 50x altcoin rally approaches. #partnercontent дальше »
2025-1-7 10:16 | |
|
|

Dogecoin Gaussian Channel Turns Green On The 4-Hour Chart, Why A New ATH Above $1 Is Imminent
Back in December 2024, the Dogecoin price entered the Gaussian Channel following a sharp decline in price as Bitcoin suffered multiple crashes. However, even though the entry was triggered by bearish forces, Dogecoin’s entry into the Gaussian Channel was bullish and showed a tendency to recover quickly from dips. дальше »
2025-1-7 22:30 | |
|
|
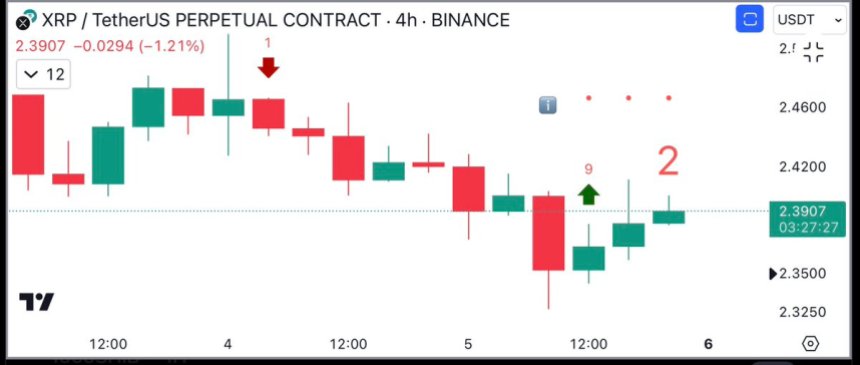
Key Indicator Signals Buy On XRP 4-Hour Chart – Analyst Predicts A Price Rebound
XRP has been navigating a period of consolidation below the $2. 50 mark, leaving investors eager to see if the altcoin is poised for another surge. After a period of bullish momentum earlier in the cycle, XRP has held steady above critical support levels, hinting at the possibility of an upcoming rally. дальше »
2025-1-7 21:00 | |
|
|


New Pi Cycle Top Prediction Chart Identifies Bitcoin Price Market Peaks with Precision
Discover the newly launched Pi Cycle Top Prediction chart, a cutting-edge tool designed to help professional investors anticipate Bitcoin’s market cycle peaks and manage risk effectively. дальше »
2025-1-7 17:44 | |
|
|

Top Analyst Predicts Solana Price Surge: Can SOL Outperform BTC and ETH?
Altcoin Sherpa, a crypto expert, provided views on the possible price trajectory of Solana (SOL) through X. His tweet highlighted Solana’s healthy exponential moving averages on the daily chart and market strength. дальше »
2025-1-4 22:30 | |
|
|
Top Analyst Predicts 2x Rally for RENDER as Key Support Holds: Here’s the Next Price Target
World Of Charts has identified a bullish setup for Render (RENDER), projecting a potential surge to $20 in the coming months. This forecast comes after a crucial technical confirmation on the RENDER/USDT chart. дальше »
2025-1-4 20:30 | |
|
|
Quant [QNT] price prediction: As THIS flips bullish, is $128 coming?
Smart money has flipped bullish on Quant after the token formed a double-top pattern on its four-hour chart. If buyers remain active, QNT could rally to $128. Quant [QNT], at press time, tThe post Quant [QNT] price prediction: As THIS flips bullish, is $128 coming? appeared first on AMBCrypto. дальше »
2025-1-3 01:00 | |
|
|
Weekly Chart Shows That Dogecoin Price Is Primed To Cross $11 In 2025, Here’s How
Crypto analyst Dima James has boldly predicted that the Dogecoin price could cross $11 in this new year. He alluded to DOGE’s weekly chart to explain why the foremost meme coin is well-primed to reach this price target. дальше »
2025-1-3 22:00 | |
|
|
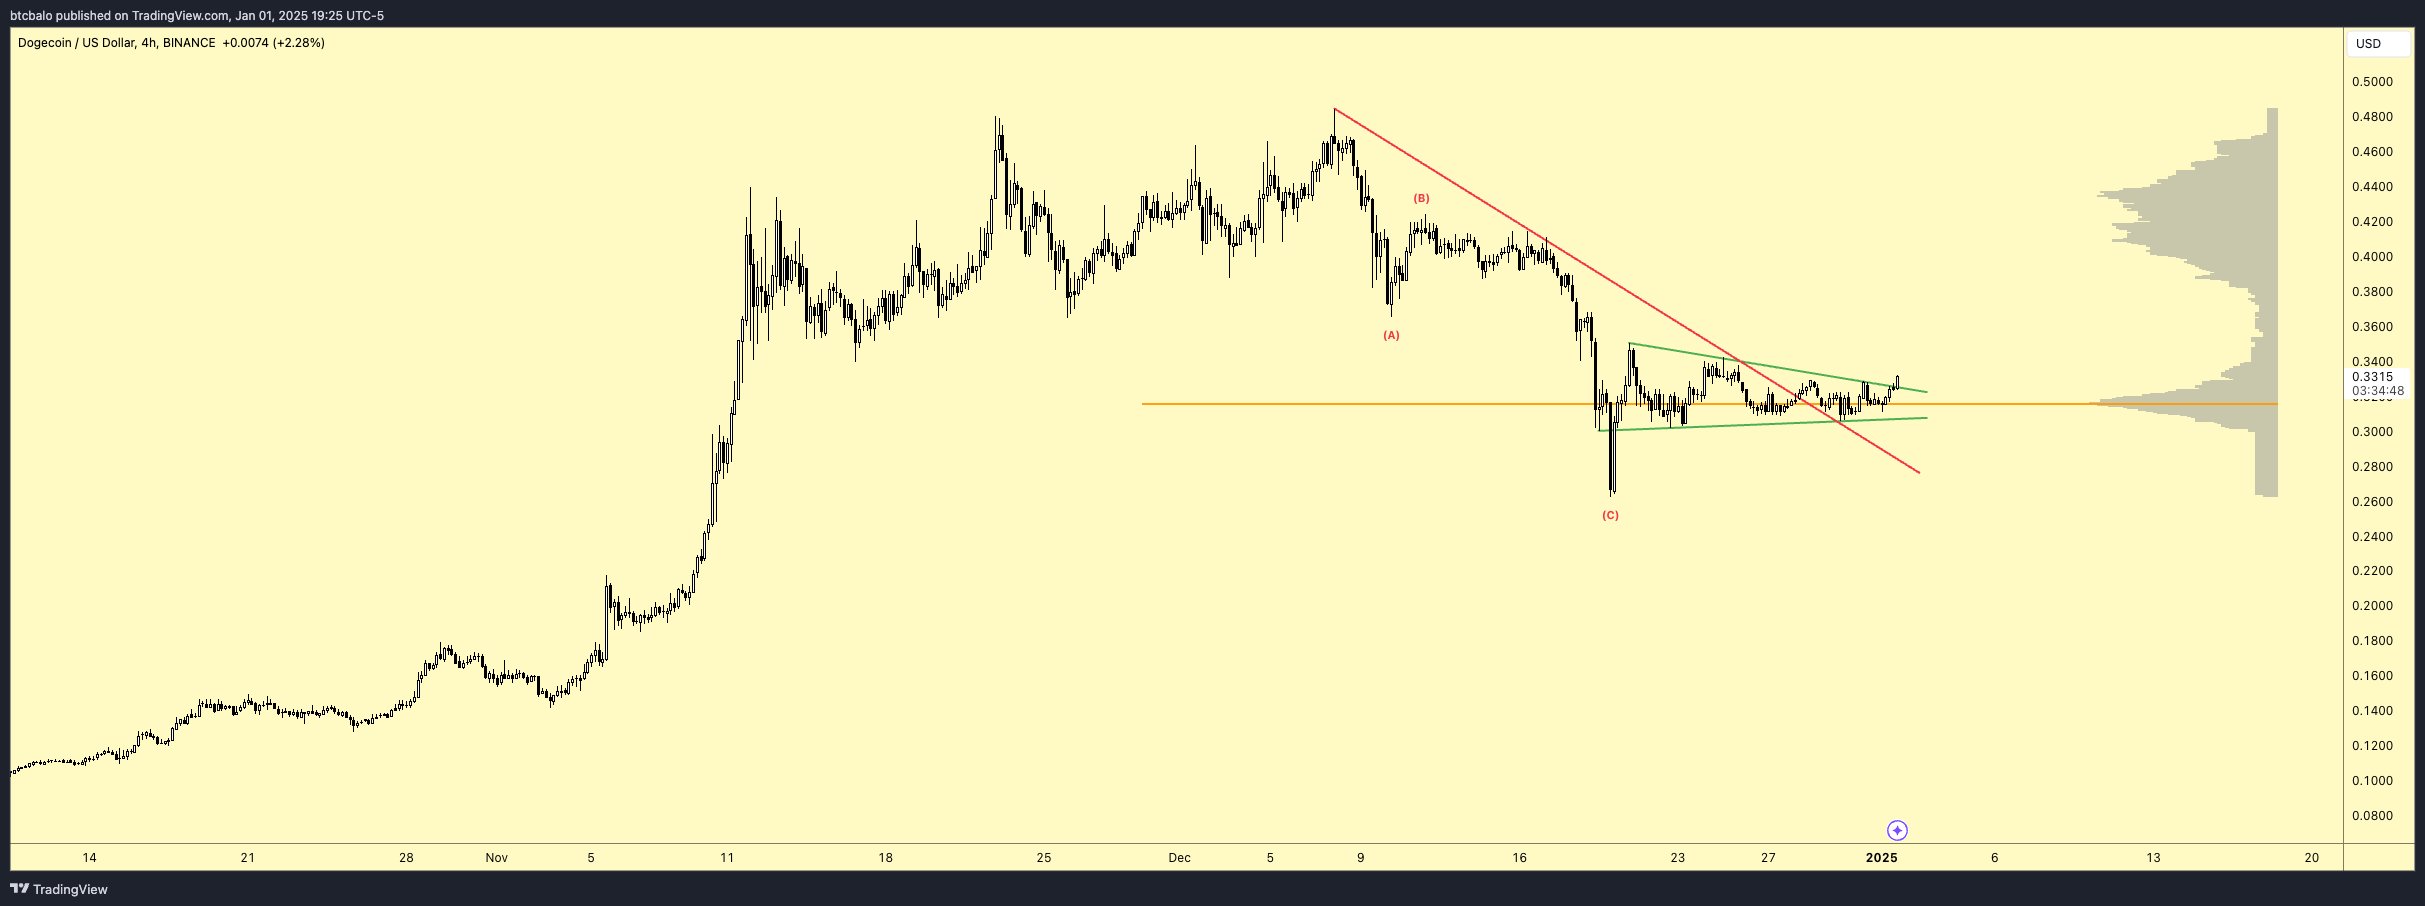
Dogecoin Price Confirms Breakout: Analyst Sets New Price Targets
Crypto analyst Balo (@btcbalo) has highlighted a major technical breakout on the Dogecoin (DOGE/USD) chart that suggests a bullish trend in the near future. Balo’s analysis, based on a 4-hour chart, points to several key technical developments that are driving expectations of a continued upward movement of the Dogecoin price. дальше »
2025-1-3 19:00 | |
|
|
Injective (INJ) Price is Testing Key Resistance Levels—Could a Rally Be on the Horizon?
INJ is getting a lot of attention in the crypto market lately. Everyone’s watching how the price moves, especially after it broke through a key price level that was holding it down. The INJ price chart indicates a prominent horizontal resistance zone between $28 and $30. дальше »
2025-1-2 19:00 | |
|
|
DOT Price Surge Incoming? The Polkadot Chart Everyone Is Talking About!
The Polkadot price is up 7%, now trading around $7. 20. This is still below $10. 73, 2024’s yearly high. World of Charts recently shared a compelling DOT chart with his 41,000 followers on X, sparking discussions across the crypto community. дальше »
2025-1-2 18:15 | |
|
|
3 key reasons BNB price may surge to $1,155 in 2025
The Binance Coin price held steady above $700, as a unique chart pattern pointed to more gains, potentially to $1,155 in the near term. Binance Coin (BNB) was trading at $707 on Jan. 1, a few points below the December… дальше »
2025-1-1 17:11 | |
|
|

X aims for super app status in 2025 with X Money, X TV and deeper AI integration
X (formerly known as Twitter) aims to chart a new course this year by blending finance, artificial intelligence, and social media into its ecosystem. On Dec. 31, CEO Linda Yaccarino teased upcoming features to provide users with broader capabilities beyond traditional social media interactions. дальше »
2025-1-1 16:31 | |
|
|
XRP Price Forms Descending Triangle On The Daily Chart, Why $1.95 Is Important
Crypto analyst Dark Defender has revealed a pattern in which the XRP price has formed on the daily chart. In his analysis, he highlighted the $1. 95 price level as being crucial as it could determine XRP’s next move. дальше »
2025-1-1 20:00 | |
|
|
Polkadot price may wake up in 2025 as a rare chart pattern forms
Polkadot price was the top laggard large-cap cryptocurrency in 2024, but a rare chart pattern points to a strong rebound in 2025. Polkdaot (DOT) retreated by over 15% this year, while other top coins like Bitcoin (BTC), Solana (SOL), and… дальше »
2025-1-1 19:38 | |
|
|
XRP, TRON chart bullish patterns; Why analysts say Lunex Network could surpass their gains
Lunex Network rises as a top contender, with analysts predicting it could surpass XRP and TRON by Q1 2025 thanks to its trading solutions and soaring presale demand. #partnercontent дальше »
2025-1-1 16:20 | |
|
|
Chainlink (LINK) Displays Bullish Pattern as Analyst Predicts Price Targets of Up to $73
Crypto analyst Alex Clay has shared a technical analysis suggesting a potential buying opportunity for Chainlink (LINK) after its retracement to key support levels. The analysis points to multiple price targets based on chart patterns and technical indicators. дальше »
2024-12-31 10:40 | |
|
|


Dogecoin Price Completes Final Retest Of Support, Here’s Where It’s Headed Next
The Dogecoin price has successfully completed its final retest of a crucial support level, signaling renewed potential for a significant rebound. According to crypto analyst Trader Tardigrade, Dogecoin could be headed to new all-time highs, as historical chart patterns suggest a parabolic surge might be on the horizon. дальше »
2024-12-30 21:30 | |
|
|
XRP volume soars 120% on XRPL meme token KCUP surge
Ripple’s XRP displays recovery signals after significant declines, down 7% lower on the weekly chart. According to Coinmarketcap, the token’s trading volume exploded by 122% to $5. 45 billion within the past 24 hours. дальше »
2024-12-31 19:30 | |
|
|
Optimism: How whales can take OP to $2.60 soon
There has been an increase in accumulation by large investors over the past 24 hours. The technical chart indicates that OP could reach $2.60, supported by the formation of a golden cross patteThe post Optimism: How whales can take OP to $2.60 soon appeared first on AMBCrypto. дальше »
2024-12-30 19:00 | |
|
|
MakerDAO revenues, fees hit fresh records - Good news for MKR?
MakerDAO monthly fees and revenues have surged to record highs, suggesting increasing network usage. MKR’s weekly chart shows mixed signals as the altcoin traded within a falling broadeningThe post MakerDAO revenues, fees hit fresh records - Good news for MKR? appeared first on AMBCrypto. дальше »
2024-12-30 14:00 | |
|
|
Метрики указали на оптимизм рынка в отношении Ethereum
На протяжении 2024 года число долгосрочных держателей Ethereum росло, тогда как у биткоина метрика неуклонно снижалась. На это обратили внимание в IntoTheBlock. This chart shows the percentage of long-term Bitcoin and Ether holders over the past year. дальше »
2024-12-31 10:17 | |
|
|
Solana: Will THIS derail SOL's bullish outlook?
Solana's transaction count has increased recently, but market activity suggested that sellers dominated. On the chart, SOL remained within a bullish pattern that could propel it back to its preThe post Solana: Will THIS derail SOL's bullish outlook? appeared first on AMBCrypto. дальше »
2024-12-30 09:00 | |
|
|

