2021-5-8 16:03 |
In this article, we will take a look at the price movement of Ethereum (ETH) and measure the increase each year, in order to see how it measures up to the current upward movement.
ETH had its most bullish year in 2018, while its most bearish year right afterwards, in 2019.
For the ETH price history analysis click here.
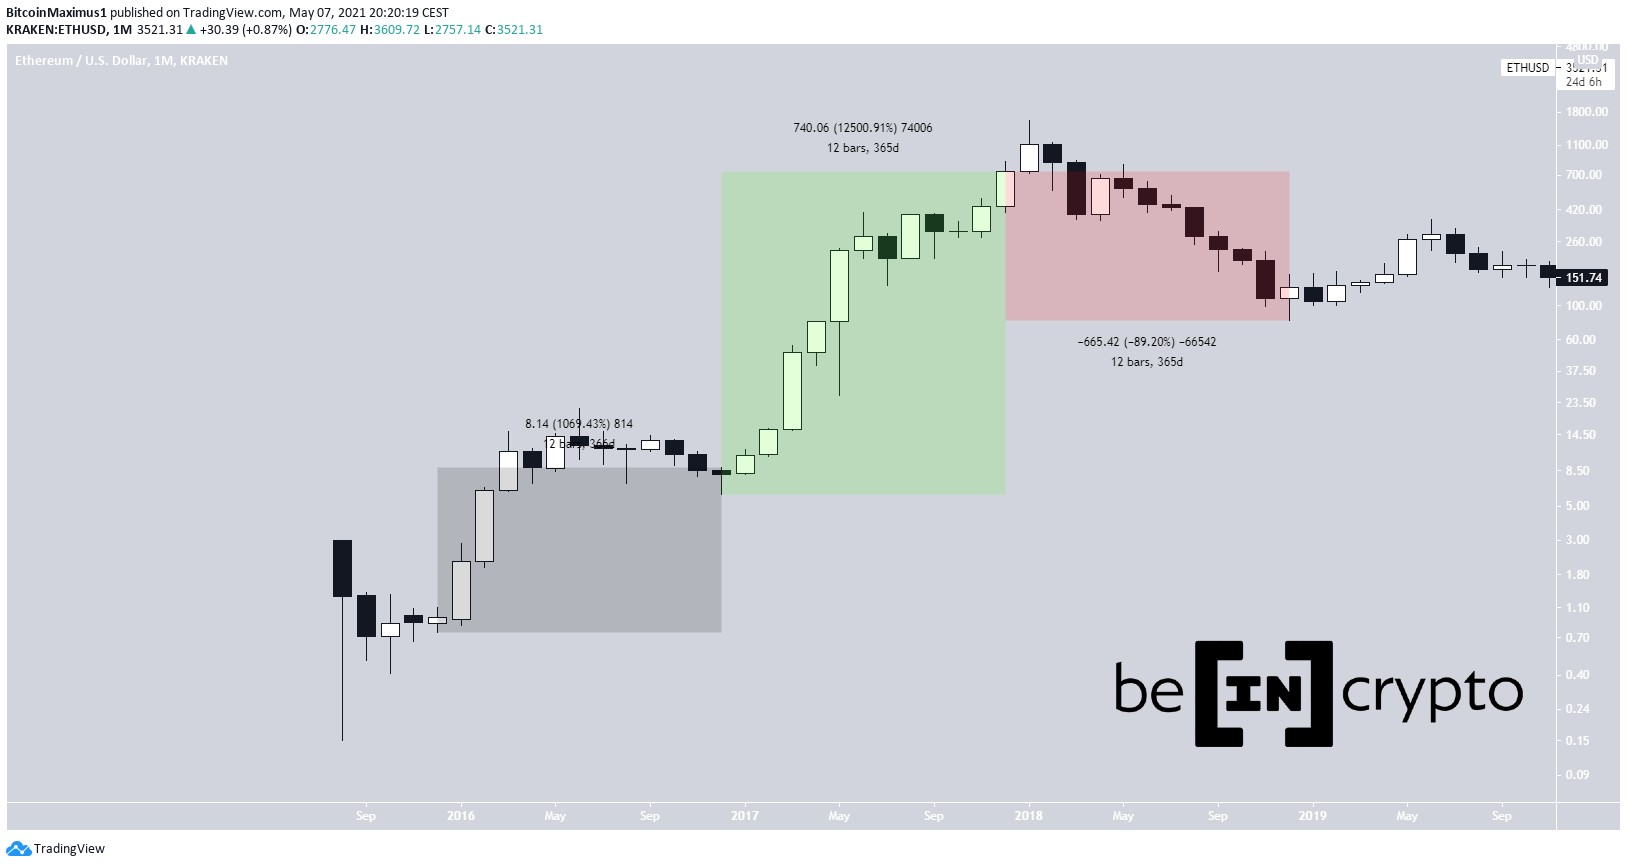
ETH from 2018 to 2020In 2016, ETH was in the initial stages of its first market cycle. ETH increased from a low of $0.76 to a high of $10.10. However, the upward portion of the movement lasted for only the first part of the year, while the second part was corrective. Afterwards, the price settled on a close of $8.07 for the year.
All in all, the token managed to increase by 1070% in 2016.
Afterwards, ETH increased for the entirety of 2017, with the exception of July and Sept. It managed to close the year at $863, an increase of 12,500% for the year. So far, this has been the most bullish year in ethereums price history.
Finally, the token decreased for the majority of 2020. It dropped by roughly 57% in March alone, and ended the year with a decrease of 89.20%, settling on a low of $130.86.
Chart By TradingView ETH from 2020 until now2019 was a year of considerable price movement. However, the end result was only an incremental change in the price. While at one point the price had moved upwards by 178%, reaching a high of $363.29, it fell once more and proceeded to close the year at $128.59 , a loss of 1.67%
2020 was a more bullish year, since it saw the token reclaim a big part of the losses from 2018. The price moved upwards by 488%, closing the year with a high of $737.45, an upward movement of 488%.
It has also been moving upwards in 2021, reaching a new all-time high of $3609 on May 6. Therefore, it has increased by 391% so far.
Chart By TradingView ConclusionTo conclude, ETH increased by the following amount each year:
2016 :1070% 2017 :12,500% 2018 : – 89.20% 2019: -1.67% 2020: 488% 2021: 391%For BeInCrypto’s latest bitcoin (BTC) analysis, click here.
The post Measuring the Yearly Increase for ETH appeared first on BeInCrypto.
origin »Bitcoin price in Telegram @btc_price_every_hour
Ethereum (ETH) на Currencies.ru
|
|