2026-2-5 00:30 |
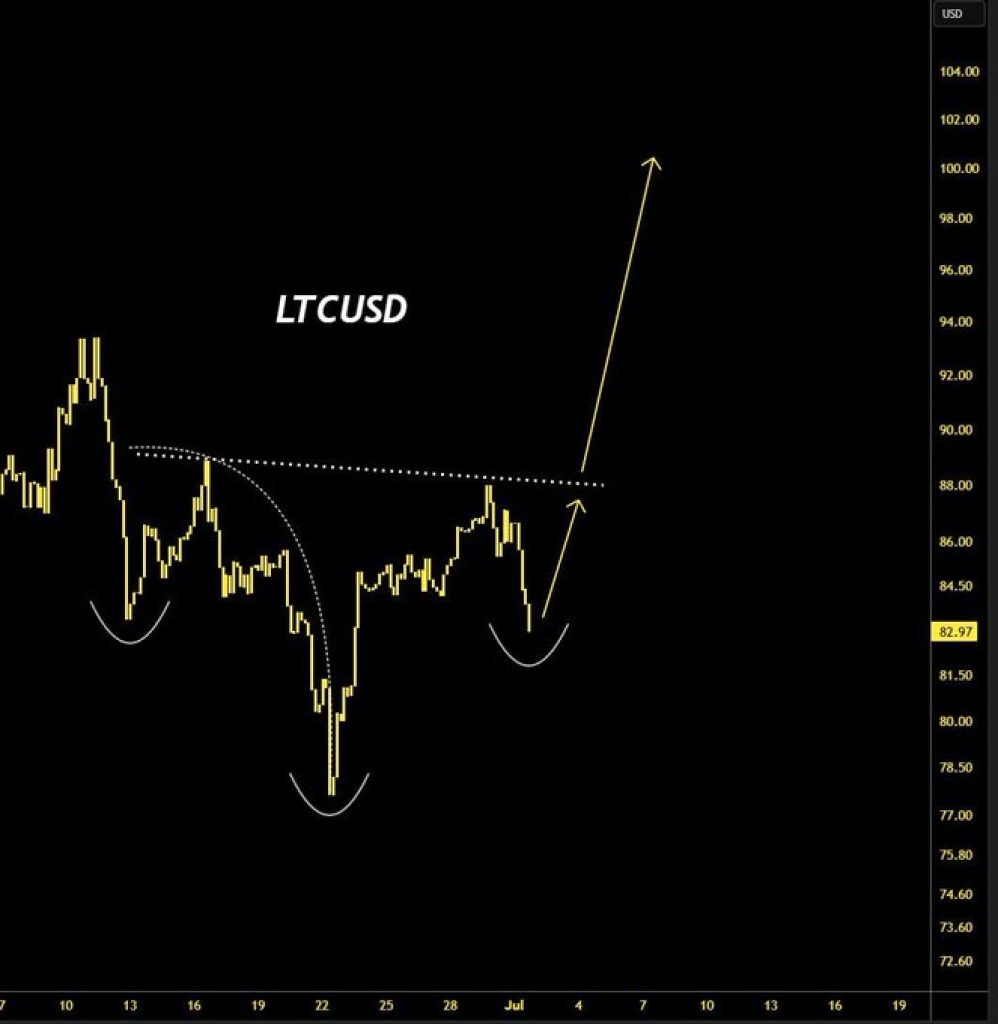
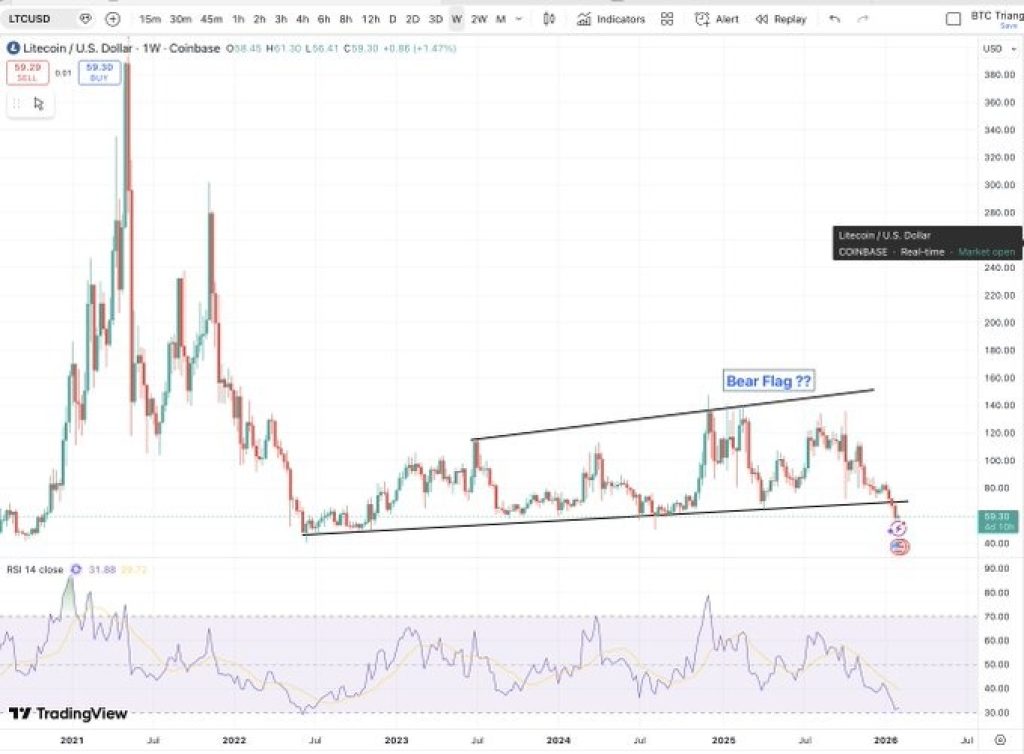
The Litecoin (LTC) price is not breaking out right now. It is breaking down. A chart shared by Matthew Dixon is putting attention on one bearish setup: a possible bear flag.
This pattern shows up when a coin drops hard, then drifts sideways before sellers step back in. Litecoin now sits near the base of that structure, and the next move could decide if more downside follows.
A bear flag is a continuation setup. Price falls hard, then moves sideways or slightly upward in a tight channel. That pause can look calm, but it often acts like the market resetting before more selling.
Matthew Dixon pointed out that Litecoin may be doing exactly that. The chart shows a long consolidation that could be the “flag,” built after a major decline. The concern comes when the base breaks.
Here’s What The LTC Chart is ShowingOn the chart, Litecoin appears to have slipped below a key support trendline. That support acted as the floor of the pattern for months.
When the LTC price breaks the lower boundary of a flag, it often signals that buyers are stepping back. Sellers regain control, and downside targets open quickly.
This is why the current level matters. Litecoin is sitting near a decision point, not a comfort zone. The RSI indicator on the chart is also leaning bearish. RSI measures buying strength versus selling strength.
Right now, the indicator sits near the lower range. Buying strength has faded. It is not deeply stretched, but buyers are no longer pushing price higher. Demand looks thin at this level.
Read Also: Aave Makes More Money Than 5 DeFi Giants Combined… So Why Is AAVE Price Asleep?
Source: X/MattewDixon What Traders Watch Next For LTCThe key question is whether Litecoin can reclaim the broken trendline. If price moves back above support, the bear flag idea weakens.
If it stays below and continues to grind lower, the pattern remains active. That would keep pressure on the chart and increase the odds of another drop.
Litecoin does not need a crash tomorrow for this setup to matter. These patterns often play out slowly, then move fast once support fully gives way.
However, the Litecoin price structure looks fragile right now. The chart shared by Matthew Dixon highlights a possible bear flag, with support starting to fail.
Until price shows strength again, traders will treat this as a bearish setup, with the risk of further downside still on the table.
Subscribe to our YouTube channel for daily crypto updates, market insights, and expert analysis.
The post Litecoin Chart Looks Ugly: Is a Bigger Drop Next for $LTC Price? appeared first on CaptainAltcoin.
origin »Bitcoin price in Telegram @btc_price_every_hour
Litecoin (LTC) на Currencies.ru
|
|