2022-10-19 16:51 |
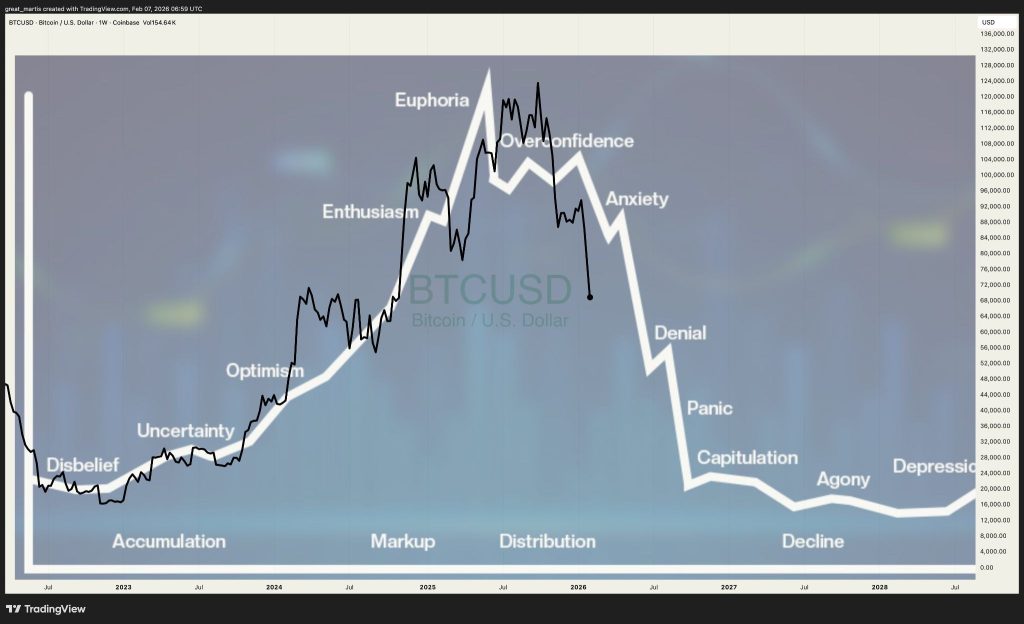
Bitcoin price remains stuck below its former all-time high set five years ago. The shocking decline has been one of the worst crypto winters on record, and the market is bracing for continued meltdown.
However, a series of on-chain indicators in BTC could provide clues to how close we are to a bottom. Let’s take a look.
A Series Of Six On-Chain Indicators Shout: Bitcoin Bottom Is InBear markets are brutal in Bitcoin or otherwise, because the bottom is only known in hindsight. The feeling that markets will fall forever, creates a fear that freezes investors from buying at long-term lows.
Technical analysis is one tool that can be used to find oversold conditions or other signals that support the idea of a bottom. Unique to cryptocurrencies, is a subset of quantitative fundamental analysis that focuses on on-chain signals. Several such tools are potentially suggesting a bottom is in.
Here we have the Puell Multiple. The Puell Multiple is calculated by dividing the daily issuance value of bitcoins (in USD) by the 365-day moving average of daily issuance value.
Puell Multiple | Source: glassnodeBitcoin Reserve Risk is currently demonstrating the most attractive risk/reward setup ever. Reserve Risk is defined as price / HODL Bank. It is used to assess the confidence of long-term holders relative to the price of the native coin at any given point in time.
Bitcoin Reserve Risk | Source: glassnodeIn this chart, we have MVRV Z-Score. The MVRV Z-Score is used to assess when Bitcoin is over/undervalued relative to its “fair value”.
MVRV Z-Score | Source: glassnodeNet Realized Losses are the largest ever. Net Realized Profit/Loss is the net profit or loss of all moved coins, and is defined by the difference of Realized Profit – Realized Loss.
Net Realized Profit/Loss | Source: glassnodeThe Realized Profits-to-Value Ratio is also in the bottom zone. The Realized Profits-to-Value Ratio is defined as the ratio of Realized Profits and Realized Cap. This metric compares profit-taking in the market with its overall cost basis on a dollar-to-dollar basis.
Realized Profits-to-Value Ratio | Source: glassnodeFinally, Net Unrealized Profit/Loss shows capitulation. Interestingly, BTC never quite reached a state of euphoria and greed during the last market top. The dataset is also becoming less volatile over time, much like Bitcoin price itself. Net Unrealized Profit/Loss is the difference between Relative Unrealized Profit and Relative Unrealized Loss.
Net Unrealized Profit/Loss | Source: glassnodeWhile none of these signals confirm the bottom is in for Bitcoin price action, each tool is in a zone that historically has been where past bear markets ended. Should the top cryptocurrency by market cap bottom here, it would be the smallest maximum drawdown in Bitcoin history.
Follow @TonySpilotroBTC on Twitter or join the TonyTradesBTC Telegram for exclusive daily market insights and technical analysis education. Please note: Content is educational and should not be considered investment advice.
Featured image from iStockPhoto, Charts from TradingView.com origin »Bitcoin price in Telegram @btc_price_every_hour
Bitcoin (BTC) на Currencies.ru
|
|