2026-2-4 14:00 |
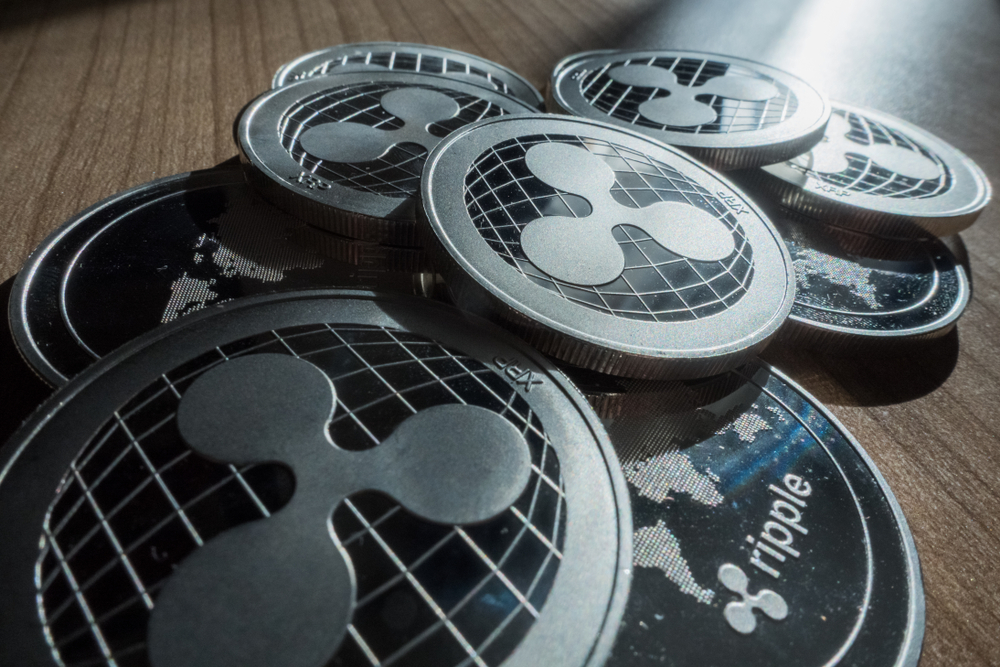
The XRP price remains under pressure in early February as broader market weakness continues to weigh on altcoins. The token is still down nearly 25% on a monthly basis and remains locked inside a long-term falling channel.
Recent rebounds have failed to shift the broader trend. Exchange flows and price structure continue to reflect elevated risk. However, deeper on-chain data suggests that recent selling pressure may be coming mainly from short-term holders rather than long-term investors. This divergence is creating a growing conflict between surface-level weakness and early signs of accumulation.
Falling Channel and Rising Exchange Inflows Signal Ongoing RiskXRP continues to trade inside a descending channel that has guided the price lower since mid-2025. Each recovery attempt has been capped near the upper trend line, while lower highs keep forming. The token is now drifting closer to the lower boundary, increasing the 25%+ breakdown risk.
XRP Price Structure: TradingViewWant more token insights like this? Sign up for Editor Harsh Notariya’s Daily Crypto Newsletter here.
At the same time, exchange flow data is flashing caution.
The exchange net position change tracks the net amount of XRP entering or leaving exchanges over a rolling 30-day period. When the indicator turns positive, it means more tokens have moved onto exchanges than off them, typically signaling rising sell-side pressure.
On February 3, this 30-day metric flipped back into positive territory, showing a net increase of nearly 396 million XRP on exchanges. This shift suggests that selling activity has started to outweigh accumulation again.
Selling Pressure Rises: GlassnodeTogether, the falling channel and rising exchange inflows indicate that sellers still retain short-term control.
HODL Waves and Long-Term Buyers Show Selling Is Concentrated in Weak HandsWhile exchange inflows look bearish at first glance, holder behavior reveals that selling is possibly concentrated among speculative traders.
HODL Waves tracks how long XRP has been held in wallets, grouping supply by holding periods. This helps identify whether short-term traders or long-term investors are driving market activity.
Recent data shows that the one-week to one-month cohort reduced its share of supply from 5.27% to 3.6% since February 1. At the same time, the one-to-three-month cohort cut exposure from 11.53% to 9.29%. These groups represent the most reactive and speculative holders in the market.
Weak Hands Dumping: GlassnodeTheir exit explains much of the recent rise in XRP exchange balances. And that’s not necessarily bad in the mid-term as speculative money can cut rallies and bounces short.
In contrast, long-term holders continue to accumulate. Hodler net position change, which tracks wallets holding XRP for more than 155 days, remains in positive territory. This indicates that experienced investors are still adding, even though buying momentum slowed slightly in early February.
HODLers Still Accumulate: GlassnodeThis pattern suggests that weak hands are distributing supply while stronger holders absorb it.
XRP’s cost basis data reinforces this view. The cost basis heatmap maps where large portions of XRP last changed hands. Recent data shows a fresh accumulation cluster forming between $1.57 and $1.58, where more than 520 million XRP have shifted ownership in recent sessions.
Cost Basis Levels: GlassnodeThis level now represents a growing support zone, as a large volume of buyers entered at these prices. When substantial supply builds at one level, it often acts as a cushion during pullbacks.
Taken together, HODL Waves, long-term accumulation, and cost basis data point to redistribution rather than broad capitulation.
Key XRP Price Levels Shape the Rebound ScenarioMomentum indicators provide another layer of confirmation.
Between late January and early February, XRP’s price trended lower while the Chaikin Money Flow (CMF) indicator trended higher. This bullish divergence shows that capital inflows increased even as prices declined, suggesting growing institutional-style accumulation.
CMF is now approaching the neutral zero line. A sustained move above this level would confirm improving capital participation and strengthen the rebound thesis.
From a technical perspective, several price levels will determine the next major move.
On the downside, $1.48 remains the most important support. A decisive break below this level would invalidate the base structure and expose $1.25. If that zone fails, XRP risks a deeper decline toward $0.94, nearly matching the projected breakdown from the falling channel.
XRP Price Analysis: TradingViewOn the upside, the first recovery barrier stands near $1.70. If confirmed, a move above $1.97 could open the path toward $2.42. Breaking $1.97 can turn the XRP price structure back to neutral from bearish, via the trendline break.
For now, XRP remains technically weak. However, rising capital inflows, steady long-term accumulation, and developing support suggest that downside pressure may be stabilizing. As long as $1.48 holds and CMF continues to strengthen, a gradual push toward $1.70 remains possible.
The post How a Bearish XRP Price Metric Is Now Fueling Bullish Hopes — $1.70 Reclaim Possible? appeared first on BeInCrypto.
origin »Bitcoin price in Telegram @btc_price_every_hour
Ripple (XRP) на Currencies.ru
|
|