Новости о Daily Chart [ Фото новости ] [ Свежие новости ] | |

Silver Eyes Lower Prices as Daily Chart Confirms Bearish Setup
Silver price tests $73 as a descending triangle on the daily chart and four-hour channel break point to a $68 target. The post Silver Eyes Lower Prices as Daily Chart Confirms Bearish Setup appeared first on BeInCrypto. дальше »
2026-4-29 00:00 | |
|
|
Will XRP price break above the symmetrical triangle as the daily MACD turns bullish?
XRP price is at $1.3575 on April 14, down 1.32% on the session, as a symmetrical triangle converges toward its apex on the daily chart. A daily MACD bullish crossover has printed simultaneously, with the histogram turning positive for the… дальше »
2026-4-15 03:00 | |
|
|
Will Solana price break out of its symmetrical triangle as a daily MACD crossover confirms?
Solana price is at $83.37 on April 14, down 3.63% on the session, as a symmetrical triangle formed on the daily chart over the past two months continues to compress price action toward its apex. A daily MACD bullish crossover… дальше »
2026-4-15 02:00 | |
|
|
Can Render price rally to $2.64 as a W pattern takes shape on the daily chart?
Render price is up 3.55% on April 9 as a W pattern develops across the daily chart, with the Supertrend flipping green and the MACD histogram turning positive for the first time in months. The $2.646 resistance is the pattern… дальше »
2026-4-10 03:25 | |
|
|
Bitcoin Chart Pattern Targets $78,000 — Key Levels to Watch
Bitcoin (BTC) price trades at $71,552 after forming a bullish continuation pattern on the daily chart that carries an 11% breakout projection. Friday’s March US CPI report is expected to show inflation jumping to 3. дальше »
2026-4-8 09:04 | |
|
|
Is Bitcoin price forming a bear flag at $66,900 as its daily MACD reaches its deepest negative reading in months?
Bitcoin is holding just above a broken support level at $66,900 as a potential bear flag forms on the 4H chart and the daily MACD hits one of its most negative readings of the current cycle, raising the risk of… дальше »
2026-4-4 03:00 | |
|
|
Solana Price Outlook: What To Expect From SOL In April 2026
Solana (SOL) price enters April 2026 under pressure. March is closing at roughly -0. 88%, extending a red streak that now stretches six consecutive months since October 2025. A head-and-shoulders breakdown on the daily chart, confirmed on March 27, opens a measured move target near $73. дальше »
2026-3-31 01:30 | |
|
|

River (RIVER) Price Keeps Pumping as TD Indicator Signals Another Rally
Prominent analyst, Ali Martinez shared something on River that makes you pay attention. He analysed the daily chart and indicated how accurate the TD Sequential indicator has been at anticipating the direction of the RIVER price. дальше »
2026-3-23 01:30 | |
|
|
Hyperliquid price prediction: can HYPE hit a new ATH after $38 break?
Hyperliquid price rose to its highest level in over a month as it touched $38. 08. The HYPE is up amid increased trading activity as open interest jumps to over $1. 56 billion. Technical indicators on the daily chart suggest a bullish continuation. дальше »
2026-3-13 18:59 | |
|
|
XRP Starts New Week With Bullish Confirmation, But This Level Is A Problem
XRP has entered the new week with a technical setup that is beginning to tilt in favor of bulls, even though the price action is stuck inside a range. A bullish divergence has appeared on the daily chart, hinting that downside momentum may be fading and that a rebound could be close. дальше »
2026-3-10 01:00 | |
|
|

OBV rises, price falls: Why TRUMP’s 'buy' signals may be misleading
The Official Trump [TRUMP] memecoin was down 95.4% from its all-time high. A recent AMBCrypto report highlighted the imbalance between $3.57 and $4.09 on the daily chart. On Saturday, the 14th of FThe post OBV rises, price falls: Why TRUMP’s 'buy' signals may be misleading appeared first on AMBCrypto. дальше »
2026-2-18 04:00 | |
|
|

Metaplanet stock falls as massive Bitcoin bet backfires
Metaplanet stock edged up just about 3% on the daily chart following the earnings release, but the broader trend remains under pressure. Despite the short-term bounce, the stock is still down roughly 37% over the past month, highlighting investor concerns… дальше »
2026-2-18 11:55 | |
|
|
Bittensor price forecast as TAO hits $200 resistance amid Upbit listing
Bittensor price rose to highs of $207 amid Upbit’s listing announcement. However, buyers retreated and saw TAO touch lows of $179. The daily chart signals a potential bullish move, and $300 could be the next target. дальше »
2026-2-17 14:27 | |
|
|
Bitcoin price confirms bullish divergence as liquidations spike, eyes $71k resistance
Bitcoin price has confirmed a bullish divergence on the daily chart as liquidation levels shot up on Monday. The daily chart for Bitcoin shows that its Relative Strength Index has formed a bullish divergence with its price, which has been… дальше »
2026-2-16 10:50 | |
|
|
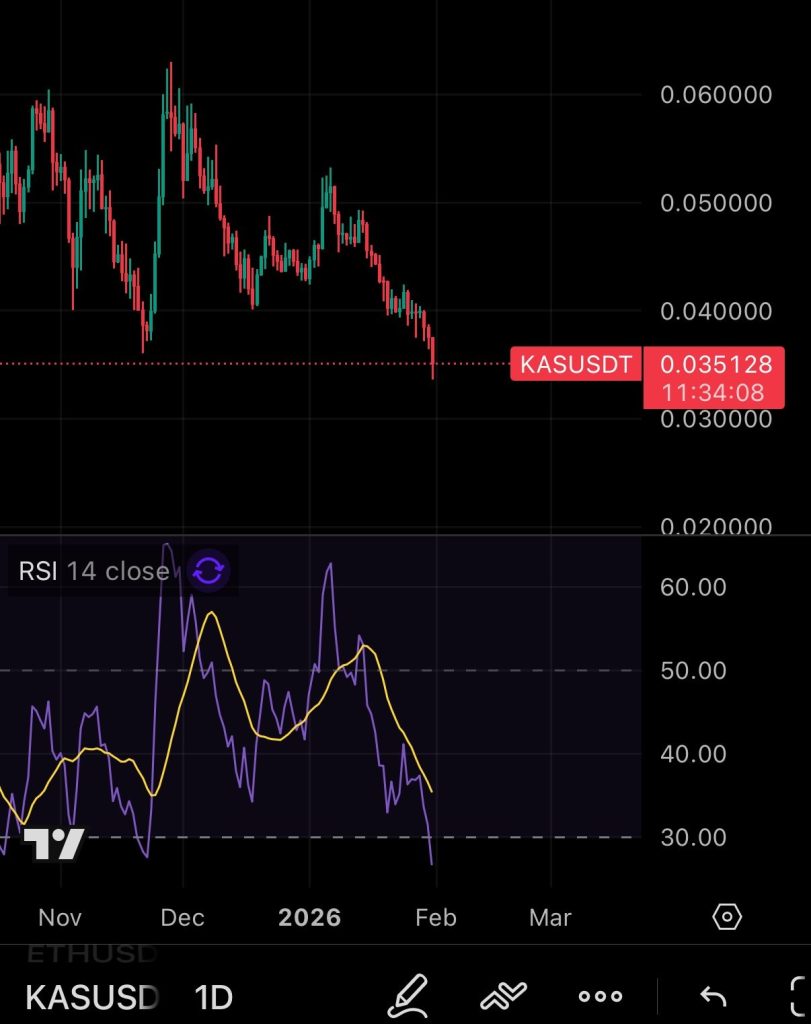
KAS Price Outlook: Oversold Conditions Put Kaspa at a Decision Point
Kaspa has been taking some heat lately, and the daily chart is starting to show the effects. As pointed out by KaspaDaily, the KAS price has now slipped into oversold territory on the daily RSI. That’s usually a sign that selling pressure is getting stretched and that the market may need a pause. дальше »
2026-2-1 01:00 | |
|
|

Grab 190M Daily Before It’s Gone: ZKP Emerges as Crypto’s First Presale Auction While AVAX and ETH Hit the Brakes
Once dominant cryptocurrencies pause at critical thresholds, focus organically transitions toward opportunity construction rather than valuation velocity. The Ethereum price chart demonstrates this uncertainty plainly, with ETH encountering distribution pressure underneath clearly marked resistance territory following current recovery efforts. дальше »
2026-2-1 20:00 | |
|
|

Zcash (ZEC) Price Prediction: More Downside Coming
Zcash is starting to lean heavily on local support after another rough daily candle, with price hovering around $336. On the chart, that support line is basically the last thing stopping a deeper slide. дальше »
2026-1-30 21:30 | |
|
|
Does Bitcoin's 9% volatility surge signal more BTC downside?
Bitcoin's [BTC] slips below $84,000 ahead of the option's expiry, and the timing matters. Bitcoin's price trends are lower on the daily chart, forming lower highs since October, which signals weakeThe post Does Bitcoin's 9% volatility surge signal more BTC downside? appeared first on AMBCrypto. дальше »
2026-1-30 20:00 | |
|
|

Bitcoin Death Cross That Last Preceded A 66% Drop Is Back
A cryptocurrency analyst has pointed out how Bitcoin has recently formed a technical crossover that preceded bearish shifts in the past. Bitcoin Has Seen A Death Cross Between 21-Day & 50-Day SMAs In a new post on X, analyst Ali Martinez has shared a daily price chart for Bitcoin showcasing a crossover between two simple moving averages (SMAs) that the asset has gone through recently. дальше »
2026-1-29 09:00 | |
|
|
Bonk Price Prediction: 6-Month Wedge Pattern Just Exploded – Most Bullish Chart in Crypto Right Now?
BONK has broken out of a six-month falling wedge on the daily chart and ended a consolidation phase that began after its mid-2025 peak. The post Bonk Price Prediction: 6-Month Wedge Pattern Just Exploded – Most Bullish Chart in Crypto Right Now? appeared first on Coinspeaker. дальше »
2026-1-29 18:49 | |
|
|
Ethereum Price Chart Warns of a 20% Crash— Can BTC-to-ETH Rotation Stop It?
Ethereum price is down about 1. 3% over the past 24 hours and nearly 10% over the past week. This is no longer just short-term volatility. On the daily chart, the ETH price has already broken below a key neckline, activating a bearish structure that warns of a potential 20% downside if support fails. дальше »
2026-1-27 15:30 | |
|
|
Pump.fun price charts a bearish wedge pattern as whales exit, will it crash?
Pump.fun has recently announced a fund designed to finance early-stage projects built openly on its platform. Despite the ecosystem-focused initiative, whale dumping, along with a bearish pattern developing on the daily chart, hints that the token may be looking at… дальше »
2026-1-22 11:49 | |
|
|
Quant: Are long-term holders positioning for a larger move? Assessing...
Quant [QNT] recorded a significant gain on the daily chart since its price broke out of a bullish pennant consolidation pattern after filling a market imbalance at $78 just five days ago. At pressThe post Quant: Are long-term holders positioning for a larger move? Assessing... appeared first on AMBCrypto. дальше »
2026-1-20 14:30 | |
|
|
XRP turns bearish after losing $2.23 – But ETF demand hints at...
XRP extended its decline on the daily chart, printing another red candle as selling pressure persisted. At press time, XRP traded near $2. 05, down roughly 2. 35% over 24 hours. Despite the price droThe post XRP turns bearish after losing $2. дальше »
2026-1-13 02:00 | |
|
|

Monero (XMR) Price Pushes to Fresh Highs as the Breakout Accelerates
Monero has finally made its move. The XMR price surged higher with a strong daily candle that carried the price into the $550 area, marking its highest level since May 2021. After months of quiet, sideways trading and steady accumulation, the chart has clearly shifted gears. дальше »
2026-1-13 20:30 | |
|
|
Pi Coin trading volume jumps 30% as price clings to $0.20 support
Pi Coin’s trading volume has started to recover from thin levels as PI trades near the $0.20–$0.21 zone, testing key support around $0.1952 on the daily chart. Pi Coin’s trading volumes increased significantly as the token reached a key support… дальше »
2026-1-10 13:33 | |
|
|
Shiba Inu (SHIB) Eyes 5-Digit Price If This Critical Golden Cross Finally Forms
The Shiba Inu coin is setting up a golden cross on the daily chart, and if it clears the 200-day curve near $0.0000106, the “delete a zero” trade stops being a meme and turns into a real breakout for the meme cryptocurrency. дальше »
2026-1-7 18:42 | |
|
|

Bitcoin is now less volatile than Nvidia, a statistical anomaly that completely changes your risk calculation
Bitcoin ended 2025 with a realized daily volatility of 2. 24%, the lowest annual reading in the asset's recorded history. K33 Research's volatility chart stretches back to 2012, when Bitcoin saw daily moves of 7. дальше »
2026-1-4 19:22 | |
|
|
TRX price confirms bullish reversal pattern amid Justin Sun’s $18M bet, targets 25% upside
TRX price rebounded following Justin Sun’s $18 million investment into Tron Inc., aimed at acquiring more TRX from the open market. Meanwhile, on the daily chart, a bullish reversal pattern has been forming that could spur more gains. According to… дальше »
2026-1-1 14:12 | |
|
|
Analyzing Canton's 18% surge: Is $0.135 target in sight for CC?
Canton Network token rebounded sharply, climbing to $0. 109 after dipping to $0. 079 three days earlier. At press time, Canton [CC] traded at $0. 1063, up 18. 24% on the daily chart, signaling renewed The post Analyzing Canton's 18% surge: Is $0. дальше »
2025-12-25 18:00 | |
|
|
Solana price forms alarming pattern, key metrics plunge
Solana (SOL) token was trading at $124.50, and could be at risk of more downside after forming bearish chart patterns on the daily chart. Some of its most important metrics have also dropped in the past few weeks. дальше »
2025-12-24 20:55 | |
|
|

Why is Monero (XMR) Price Pumping Hard Today?
Monero has been quietly doing its own thing while the rest of the market chops around. On the daily chart, the XMR price keeps holding its structure, printing higher highs and higher lows, even when momentum across crypto fades. дальше »
2025-12-22 23:30 | |
|
|
ETH price forms bearish setup amid six-day ETF outflow streak, more losses coming?
Ethereum price dropped nearly 18% over the past week as U.S. Ether ETFs logged six straight days of outflows that seem to be weighing on investor sentiment. A bearish reversal pattern on the daily chart now flags the risk of… дальше »
2025-12-19 13:26 | |
|
|
PYTH rallies 7% after Pyth Network announces revenue-backed buybacks
Cryptocurrencies performed relatively well on Friday as the value of all tokens increased by 3% in a day to $3. 14 trillion. Amidst the improved sentiments, PYTH outperformed the broader market with a nearly 7% uptick on its daily chart. дальше »
2025-12-13 21:41 | |
|
|
Bitcoin Builds Short-Term Strength — $95,000 Now the Level That Matters
Bitcoin is up almost 2% in the past 24 hours and is holding steady above $92,200. The daily chart still looks slow, but the 4-hour chart shows early strength building. Since short-term charts capture shifts faster, the next few sessions may decide whether Bitcoin finally tests $95,000 — a level experts believe is crucial to The post Bitcoin Builds Short-Term Strength — $95,000 Now the Level That Matters appeared first on BeInCrypto. дальше »
2025-12-12 14:33 | |
|
|
What is the current state of XRP's price action?
Key Takeaways What are the different timeframe charts telling traders? The weekly XRP chart showed a retracement was underway, while the daily and 4-hour charts showed a bearish structure and momentThe post What is the current state of XRP's price action? appeared first on AMBCrypto. дальше »
2025-11-20 04:00 | |
|
|
Hyperliquid price risks 70% crash as multiple bearish patterns emerge
Hyperliquid price showed strength despite the broader market sell-off on Tuesday. However, multiple bearish patterns forming on the daily chart signal a potential crash may be on the horizon. According to data from crypto. дальше »
2025-11-18 13:08 | |
|
|
Chainlink price slides toward $13 as bearish signals mount: is an $8.50 retest next?
Chainlink price broke below $14 on Monday and traded to lows of $13. 45 amid a spike in volume. LINK shows weakness as a bearish setup forms on the daily chart. Bears could target $10. 97 if weakness intensifies near $13. дальше »
2025-11-17 18:41 | |
|
|
XRP price forms a death cross, how low can it go?
XRP price has confirmed a highly bearish pattern on the daily chart, as risk-averse sentiment continues to weigh over the broader crypto market. According to data from crypto.news XRP (XRP) dropped 7% over the past 24 hours to an intraday… дальше »
2025-11-14 15:28 | |
|
|