Новости о Bottom Pattern [ Фото новости ] [ Свежие новости ] | |

XRP price eyes 25% gain; did Ripple bulls make a comeback
XRP price has formed a bottom reversal setup which suggests the possibility of an explosive move favoring the bulls. Moreover, Ripple has already breached the pattern, suggesting the start of this ralThe post XRP price eyes 25% gain; did Ripple bulls make a comeback appeared first on AMBCrypto. дальше »
2022-3-20 02:30 | |
|
|
Cardano: This new bullish pattern holds big promise for a recovery to $1
Cardano price shows signs of coming around after months of downtrend. The four-hour chart shows that ADA has formed a bottom reversal pattern suggesting a reversal in trend. Therefore, investors neThe post Cardano: This new bullish pattern holds big promise for a recovery to $1 appeared first on AMBCrypto. дальше »
2022-3-20 22:30 | |
|
|
Uniswap all ready to kick-start its rally thanks to these reasons
Uniswap price has set up a perfect bottom reversal setup that suggests a shift in trend favoring the bulls. This pattern comes at a time when BTC is consolidating, giving the possibility of a bullish The post Uniswap all ready to kick-start its rally thanks to these reasons appeared first on AMBCrypto. дальше »
2022-3-19 23:30 | |
|
|
A bullish uptick on the cards, but how well can Enjin Coin really rally
Enjin Coin price shows the formation of a bottom reversal pattern on the four-hour chart, indicating that it is due for a quick run-up. Supporting this view are two on-chain metrics that solidify the The post A bullish uptick on the cards, but how well can Enjin Coin really rally appeared first on AMBCrypto. дальше »
2022-2-23 01:30 | |
|
|
Is The Bitcoin Bottom In? Here’s What SOPR Data Says
Bitcoin has continued its rally breaking above $42k today, making many wonder whether $33k was the bottom. Here’s what the SOPR data says about it. Bitcoin Short-Term Holder SOPR Starts Turning Green Again As explained by an analyst in a CryptoQuant post, the current BTC SOPR pattern may look similar to that around the bottom formation back in July of last year. дальше »
2022-2-8 22:00 | |
|
|

2 Reasons Why Current “Frying Pan” Bottom Is Extremely Bullish For Bitcoin
Bitcoin bulls could be on to something splendid after price printed a bullish reversal pattern on Thursday, days after losing grip of the $53,000 support. According to Mathew Hayland, a seasoned crypto technical and on-chain analyst, Bitcoin’s price is slowly forging a pattern that could ignite a spirited bullish run once various conditions are met. […] дальше »
2021-12-24 16:47 | |
|
|
TA: Bitcoin Prints Bullish Pattern, Why BTC Could Surge To $50K
Bitcoin is forming a double bottom pattern near the $45,500 zone against the US Dollar. BTC is rising and there could be an upside break above $47,200. Bitcoin started an upside correction from the $45,500 support zone. дальше »
2021-12-21 06:08 | |
|
|
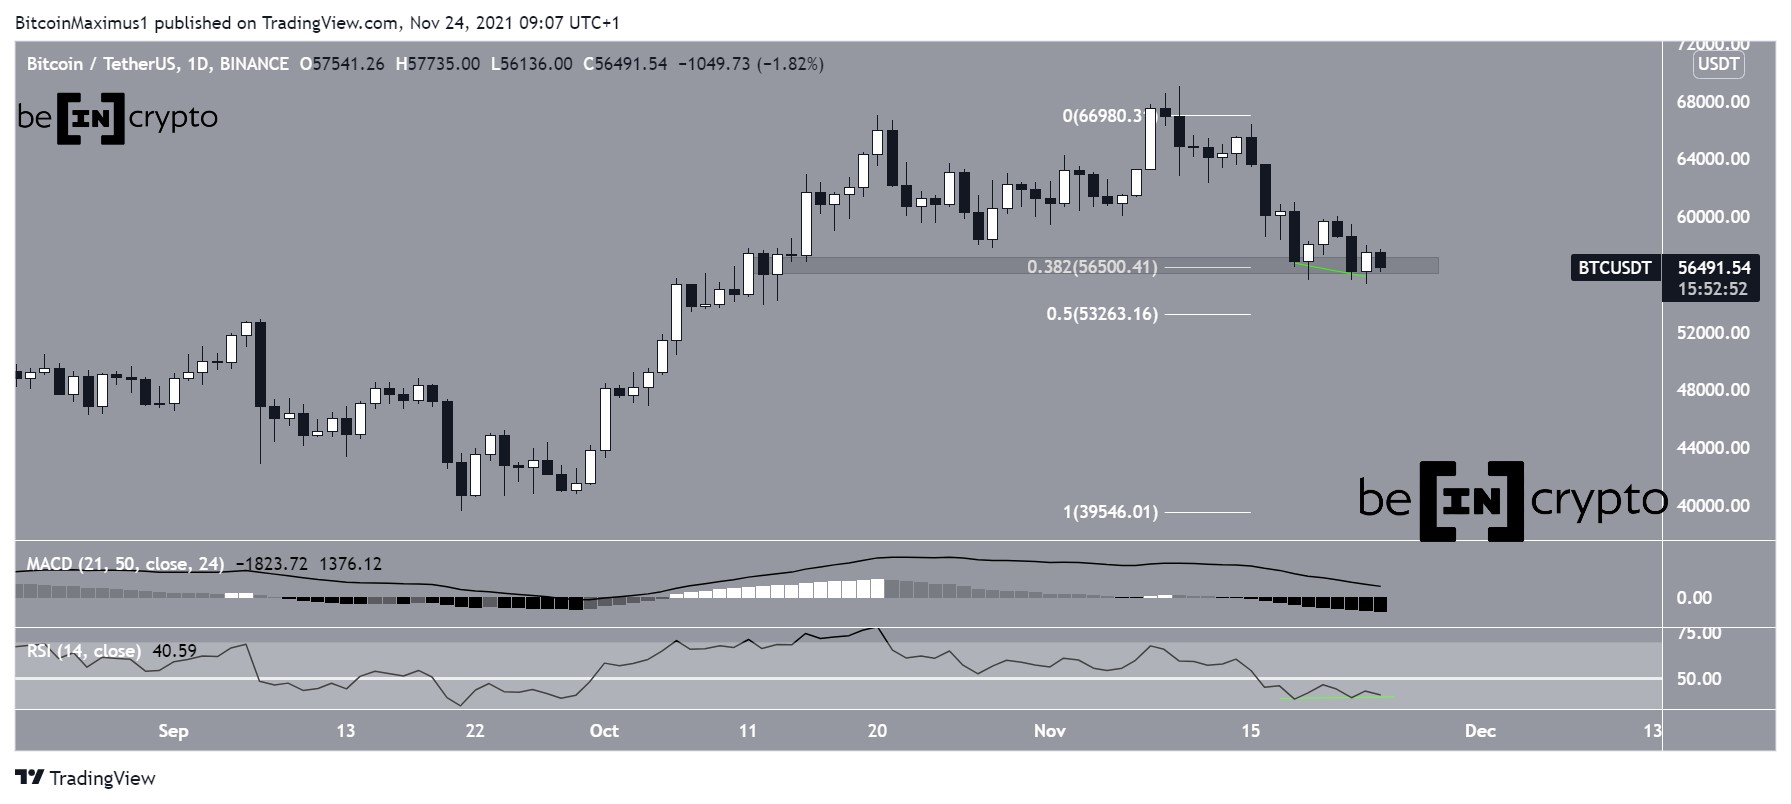
Bitcoin (BTC) Creates Bullish Pattern Inside Support Range
Bitcoin (BTC) has completed a double bottom pattern and could soon confirm it with a strong bounce towards resistance. The post Bitcoin (BTC) Creates Bullish Pattern Inside Support Range appeared first on BeInCrypto. дальше »
2021-11-24 11:53 | |
|
|
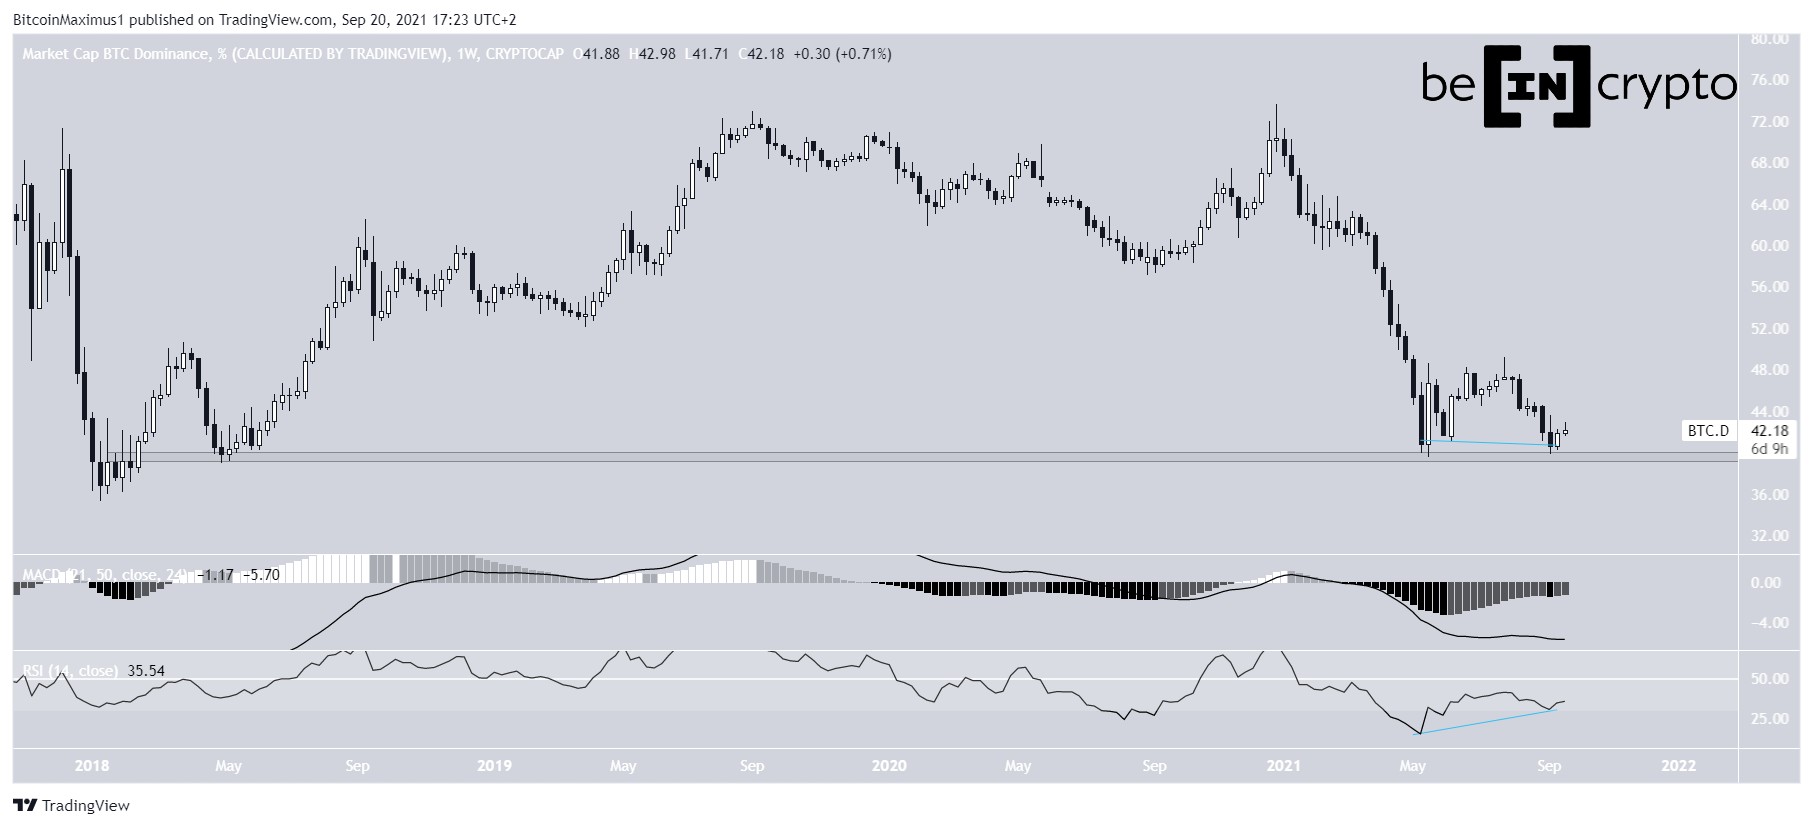
BTCD Bounces at Long-Term Support
The Bitcoin dominance rate (BTCD) has created a long-term double bottom pattern close to the 39.50% long-term support area. The post BTCD Bounces at Long-Term Support appeared first on BeInCrypto. дальше »
2021-9-20 20:40 | |
|
|


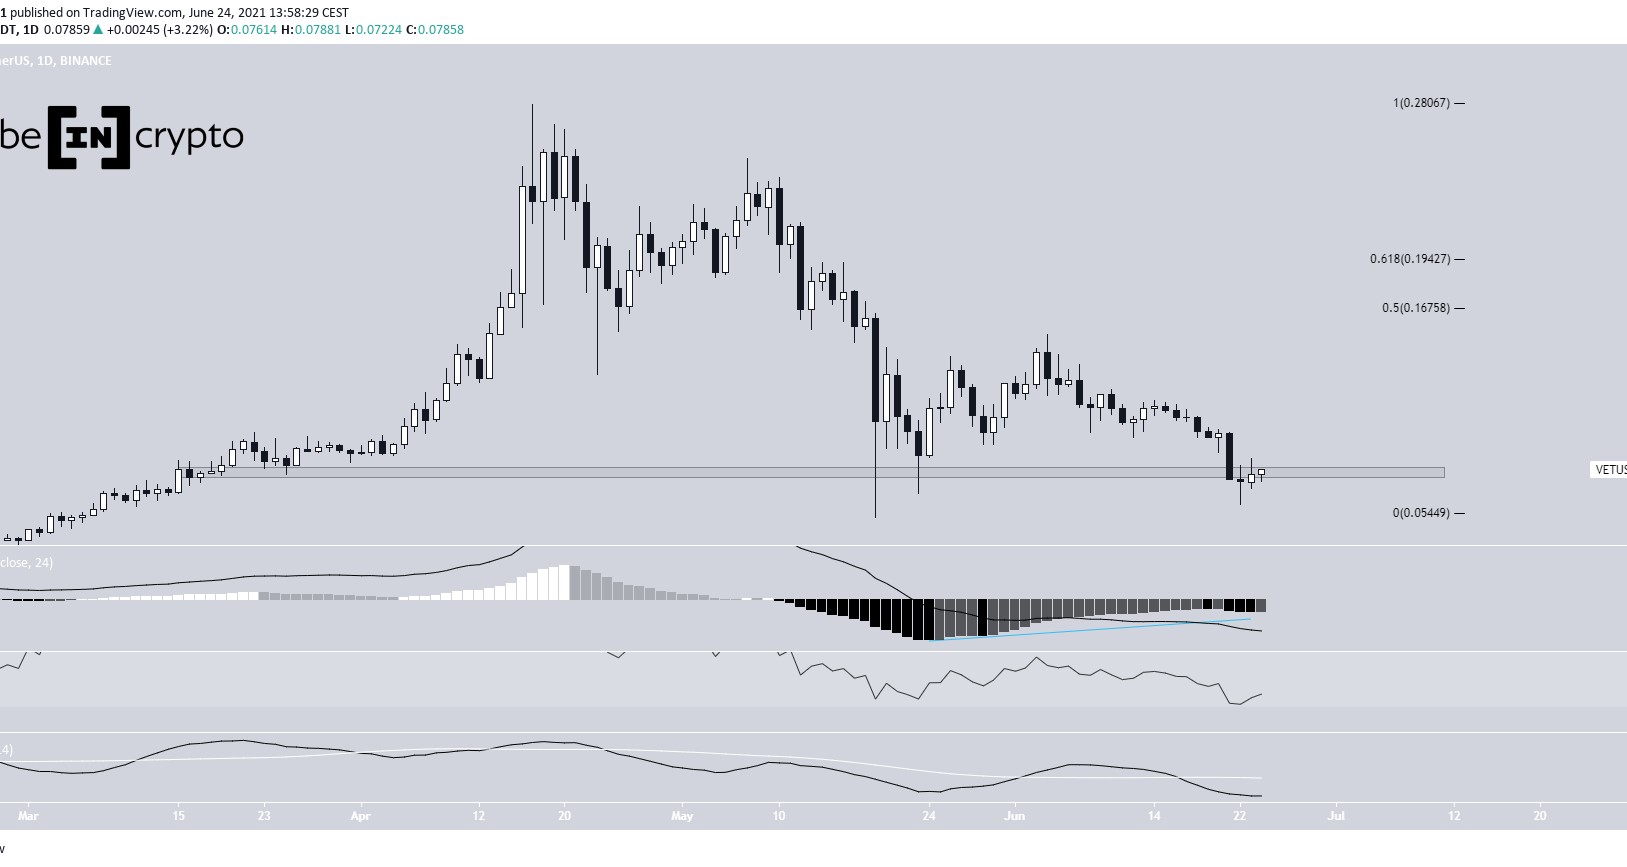
HBAR, ENJ & HNT – Altcoins Hold Steady While BTC Ranges
Hedera Hashgraph (HBAR) is trading inside a descending parallel channel and bounced on its support line on June 22. Enjin Coin (ENJ) has created a double bottom pattern and broken out from a descending resistance line. дальше »
2021-7-3 13:48 | |
|
|
Binance Coin, Dogecoin, Tron Price Analysis: 08 June
Binance Coin's ascending triangle was negated once the price breached past the bottom trendline of the pattern. Dogecoin's movement was hardly a surprise as the formation of a descending triangle inclThe post Binance Coin, Dogecoin, Tron Price Analysis: 08 June appeared first on AMBCrypto. дальше »
2021-6-9 02:00 | |
|
|

Bitcoin (BTC) Attempts Breakout From Short-Term Consolidation Pattern
The Bitcoin (BTC) price has been consolidating inside a symmetrical triangle pattern since reaching a local bottom on May 19. The post Bitcoin (BTC) Attempts Breakout From Short-Term Consolidation Pattern appeared first on BeInCrypto. дальше »
2021-6-3 09:55 | |
|
|
TA: Bitcoin Aims Strong Recovery, Here’s A Key Pattern For Short-term Bottom
Bitcoin price is likely forming a double bottom pattern near the $42,150 zone against the US Dollar. BTC is showing positive signs and it could climb towards $47,000. Bitcoin is finding a strong buying interest above the $42,000 and $42,150 support levels. дальше »
2021-5-18 06:08 | |
|
|
Powerful Bottom Signal Spotted In XRP, But There’s A Catch
XRP price is back trading at right around a dollar per token, but according to a rare bottoming pattern spotted by a legendary technical trader on the Bitcoin trading pair, the surge is only just getting started. дальше »
2021-4-8 23:00 | |
|
|
Origin Protocol (OGN) Bounces After Long-Term Bullish Pattern
It’s possible that OGN has completed a short-term correction and will head upwards toward $0. 21. Origin Protocol Double Bottom And Breakout On Nov. 5, OGN reached a low of $0. 106, which was very close to the all-time low price of $0. дальше »
2021-1-11 15:10 | |
|
|
Ethereum Could Stage Strong Rally As Double Bottom Pattern Emerges
Ethereum nosedived below the $202 support zone against the US Dollar. ETH price revisited the $192 support and it seems like there is a key double bottom pattern forming near $192. Ethereum declined more than 5% and it tested the main $192 support zone. дальше »
2020-5-22 11:08 | |
|
|
Diamonds Are Forever: Bitcoin and XRP Just Formed an Ultra-Rare Bottom Pattern
Bitcoin and XRP have both made strong recoveries since their epic plunge last month amidst the Coronavirus panic selloff that rocked the stock market. The V-shape bottom and previous top have potentially formed an ultra-rare diamond bottom pattern across the two crypto assets. дальше »
2020-4-16 18:00 | |
|
|

Analyzing Bitcoin’s 2018 Correction in Order to Predict the Bottom
The Bitcoin price has been in a long-term correction since reaching $13,880 on June 24, 2019. The pattern of the correction shares some similarities with that after the price reached its current all-time high in December 2017. дальше »
2020-4-7 16:10 | |
|
|

Bitcoin Moves Above $7,000, Targets Key Resistance Level
Since reaching a bottom of $3,782 on March 13, the BTC price has been increasing. The increase has taken the from of an ascending wedge, which is considered a bearish reversal pattern. Since reaching the aforementioned bottom, the BTC price has increased by almost 90%. дальше »
2020-4-7 19:15 | |
|
|
Waves, Verge, Ethereum Price: Waves' double bottom pattern shows promise of 23%-37% surge
Only, the Waves token shows promise with the formation of a double bottom pattern. Ethereum and Verge are all exhibiting bearish sentiment. Ethereum is stuck between the 50 and 200DMA while, Verge is The post Waves, Verge, Ethereum Price: Waves' double bottom pattern shows promise of 23%-37% surge appeared first on AMBCrypto. дальше »
2020-4-6 23:30 | |
|
|
Tezos (XTZ) Price Up 62% From Bottom, Can The Bulls See More Gains?
After the initial 47% crash on March 12, Tezos dropped down to $0.95 but saw a significant 85% recovery the same day closing at $1.76. The digital asset is currently in a confirmed daily equilibrium pattern which is currently in slight favor of the bears but could soon change. The bulls are facing the daily […] дальше »
2020-4-1 21:55 | |
|
|
Bitcoin Price Still Following Exact Pattern That Marked 2018’s $3,000 Bottom
Over the past day or two, the price of Bitcoin has continued to show signs of strength, rallying as high as $6,800 on Tuesday afternoon (TradingView data) as global markets begin to show signs of recovery after weeks of downward price action. дальше »
2020-3-25 13:00 | |
|
|

TRX’s Bullish Reversal Pattern Reaffirms the Bullish Trend
The TRX price has successfully completed a double bottom, which is considered a bullish reversal pattern. As long as it stays above the $0. 02 area which is now acting as support, we are expecting the price to continue moving upwards. дальше »
2020-2-25 05:18 | |
|
|
Analyst Prices Bitcoin at $400k By Next Year Based on Miner Capitulation Pattern
The Bitcoin Performance Since Difficulty Bottom chart shows the formation of a cup pattern peaking in spring 2021. This price prediction tool puts Bitcoin at an astonishing $400k by then. #bitcoin $10k … it's getting really interesting now pic. дальше »
2020-2-19 16:26 | |
|
|
Bitcoin Indicator that Crashed Price to $3.1K Returns: The Dreaded Death Cross
Bitcoin is looking to repeat a technical pattern that crashed its price to $3,120 in late 2018. The leading cryptocurrency by valuation made a rebound from levels near $13,920 during June 2019. It plunged by more than 53 percent in the later sessions, falling to establish a local bottom towards $6,410. дальше »
2020-1-22 17:31 | |
|
|

ATOM Reversal Pattern Could Take it to 64,000 Satoshis
The Cosmos (ATOM) price has created a reversal pattern at the support area of 49,000 satoshis. From this level, the price is expected to continue moving upwards. Besides the reversal pattern (double bottom), the upward movement is supported by the ascending support line, which has been measuring ATOM’s rate of increase since October. дальше »
2020-1-17 10:20 | |
|
|
Ethereum to suffer more before it spikes to $170 - $180
Ethereum has been free-falling for quite a while now and yet, the bottom doesn't seem to be in yet. However, a largely bullish pattern has formed, with ETH bouncing in it and starting its mini-rally oThe post Ethereum to suffer more before it spikes to $170 - $180 appeared first on AMBCrypto. дальше »
2019-12-31 01:30 | |
|
|

Price Analysis Dec 25: BTC, ETH, XRP, BCH, LTC, EOS, BNB, BSV, XTZ, TRX
Bitcoin is forming a basing pattern and a breakout of the consolidation will confirm a likely bottom
дальше »2019-12-26 20:48 | |
|
|

Top-5 Cryptos This Week: HT, BTC, TRX, NEO, LEO
Altcoins continue to post incremental gains and traders are watching to see if Bitcoin can form a double bottom reversal pattern by rising above $7,900
дальше »2019-12-23 21:26 | |
|
|
Lisk Price Analysis LSK / USD: Reaching The Bottom
Lisk has a bearish short-term outlook, with the cryptocurrency still trading below its 200-period moving average on the four-hour time frame The four-hour time frame shows that a bearish head and shoulders pattern has been triggered The daily time frame continues to show a large broadening wedge pattern Lisk / USD Short-term price analysis Lisk […] The post Lisk Price Analysis LSK / USD: Reaching The Bottom appeared first on Crypto Briefing. дальше »
2019-8-8 16:36 | |
|
|
Binance Coin Price Analysis: Bullish Reversal On The Cards
Binance Coin has dropped to the bottom of a clear falling wedge pattern after crashing 20% against BTC pairing over the last 2 weeks. A short-term reversal could be on the cards if this particular formation plays out. дальше »
2019-8-7 20:32 | |
|
|
Waves Price Analysis WAVES / USD: Oscillating At The Bottom
Waves has a bearish short-term outlook, with the cryptocurrency under heavy technical pressure The four-hour time frame shows that sellers have now invalidated a bullish inverted head and shoulders pattern The daily time frame shows that the WAVES / USD pair is trading within a large falling wedge pattern Waves / USD Short-term price analysis […] The post Waves Price Analysis WAVES / USD: Oscillating At The Bottom appeared first on Crypto Briefing. дальше »
2019-7-5 16:20 | |
|
|
Basic Attention Token (BAT) Price Prediction 2019 – Bulls Are Staging A Comeback (June 2nd Update)
Daily BATBTC It appears that BAT has finished with its prolonged correction phase and is now preparing for a move up. A bullish spinning top candlestick pattern is the strongest signal for a trend reversal. дальше »
2019-6-2 05:15 | |
|
|
Enjin Coin (ENJ) Price Prediction 2019, 2020, 2023 and Beyond – Time For ENJ To Join The Mini-Moon Party (May 16th Update)
Mid May Update: Technicals Daily ENJBTC On the daily chart, ENJ defended the bottom at 1671 satoshis and we see a formation of a doji candlestick pattern – a bullish reversal signal. The MA200 is acting as a support at these levels and with volume picking up, we should see a lift off in ENJ. дальше »
2019-5-16 01:51 | |
|
|
3 Reasons Bitcoin Will Race Toward a New Record High at $20,000
By CCN: The bitcoin price surged as much as 7. 60-percent on Friday to establish a new 2019 peak at $5,796. 93. The uptrend pushed bitcoin’s year-to-date rally to an impressive 54. 08-percent. дальше »
2019-5-4 00:10 | |
|
|

Delphi Digital's Latest Report Says Bitcoin’s Market Cycle Is Right on Track
Delphi Digital has returned with another installment of its unspent transaction output (UTXO) reports. Recalling its report from January of this year, the research firm says bitcoin’s market cycle is right on track. дальше »
2019-5-3 18:44 | |
|
|
Will Bitcoin complete the double bottom pattern or has the bull run actually started?
Bitcoin collapsed by 9% on almost all exchanges when the Bitfinex and Tether news broke out, however, on Kraken, the price fell as low as, ~$4,300. Based on past data, it can be assumed [with a grain of salt] that there is a possibility of the formation of a double bottom pattern, as it did […] The post Will Bitcoin complete the double bottom pattern or has the bull run actually started? appeared first on AMBCrypto. дальше »
2019-4-29 01:30 | |
|
|

Bitcoin Forms First ‘Golden Cross’ Since 2015 Price Bottom
For the first time since 2015, the Bitcoin price action has formed a “golden cross” pattern providing yet another signal that BTC is in a bull market. It also broke through the $5,600 price mark, setting a new 2019 high. дальше »
2019-4-23 16:00 | |
|
|
Bullish Bitcoin Price Formation Hints At Short Term Move Above $6K
Ever since the start of April when Bitcoin price rallied nearly a grand in roughly an hour, bullish sentiment has returned to the crypto market, and many have begun confidently calling the bottom as in. дальше »
2019-4-23 23:00 | |
|
|
Binance Coin surges by 9% in 24-hours after DEX announcement; breaks out of ‘saucer bottom’ pattern
Binance Coin [BNB] is nothing short of becoming the best performing crypto asset of 2019, as it creates higher highs every day. In a recent surge, BNB went up by approximately 12% in 24-hours breaking out of the ‘saucer bottom’ pattern. дальше »
2019-4-19 17:10 | |
|
|

Touted Bottom Pattern Won’t F**k Bears, But Bitcoin (BTC) Bulls Instead: Analyst
Textbook Bottom Indicates Bitcoin Is Ready To Rally Take a look at the two images below. On the right is an excerpt from the “Encyclopedia of Chart Patterns” by Thomas Bulkowski, which shows something called. дальше »
2019-4-19 09:30 | |
|
|
Bitcoin Price: Textbook Stock Trading Indicator Forecasts 31% Rally
By CCN: The bitcoin price could attempt a runup towards $6,800 in the near-term, according to one popular stock trading indicator. Bitcoin on the Verge of a Bump-And-Run Reversal? Dubbed a Bump-and-Run Reversal (BARR), the pattern includes three crucial phases before an asset undergoes a full-blown breakout session. дальше »
2019-4-19 23:44 | |
|
|
Bitcoin: BARR Pattern suggests that BTC might have bottomed in 2018
A Twitter user suggested the formation of BARR [Bump and Run Reversal] Pattern, which suggests that Bitcoin already bottomed in the month of December 2018. According to Twitter user @thalamu_, Bitcoin hit bottom on December 15, 2018, when the price of Bitcoin fell as low as $3,126 [BitMEX]. дальше »
2019-4-17 16:45 | |
|
|
Bitcoin (BTC) Trend Overwhelmingly Positive As Bulls Eye $5,400
Bitcoin price formed a double bottom pattern near $4,940 and climbed higher against the US Dollar. Bulls pushed the price above the key $5,150 and $5,160 resistance levels. Yesterday’s highlighted major bearish trend line was breached at $5,110 on the hourly chart of the BTC/USD pair (data feed from Kraken). дальше »
2019-4-17 09:30 | |
|
|
Криптоаналитик Джош Рейджер: В июле нас ждёт уверенный рост цены биткоина
Трейдер и криптоаналитик Джош Рейджер предположил, что фаза накопления биткоина продлится до середины июля, затем последует уверенный рост цены. $BTC Accumulation Pattern It took Bitcoin 216 days for accumulation from bottom to spring in 2015 If this were accumulation, this week's $1000 candle would be the exact middle of 216 accumulation days and would end […] Запись Криптоаналитик Джош Рейджер: В июле нас ждёт уверенный рост цены биткоина впервые появилась Криптовалюта.Tech. дальше »
2019-4-7 16:23 | |
|
|