2019-4-7 03:30 |
The latest Bitcoin-propelled rally pushed the collective crypto-market to fresh gains. The bulls broke resistance levels for both Ethereum [ETH] and Tron [TRX].
At press time, the second largest crypto-asset ETH held a market cap of $17.27 billion and was priced at $163.6, according to the CoinMarketCap. The coin recorded a 24-hour trading volume of $6.75 billion and exhibited a slight decline of 0.76% during the same time frame. ETH further exhibited a major 14.66% rise over the week.
The eleventh largest digital asset, Tron [TRX], registered a market cap of $1.77 million and a 24-hour trading volume of $369.1 million. TRX was valued at $0.026 and exhibited a slip of $1.84% over the past 24 hours. Additionally, a significant surge of 13.72% was seen over the last seven days.
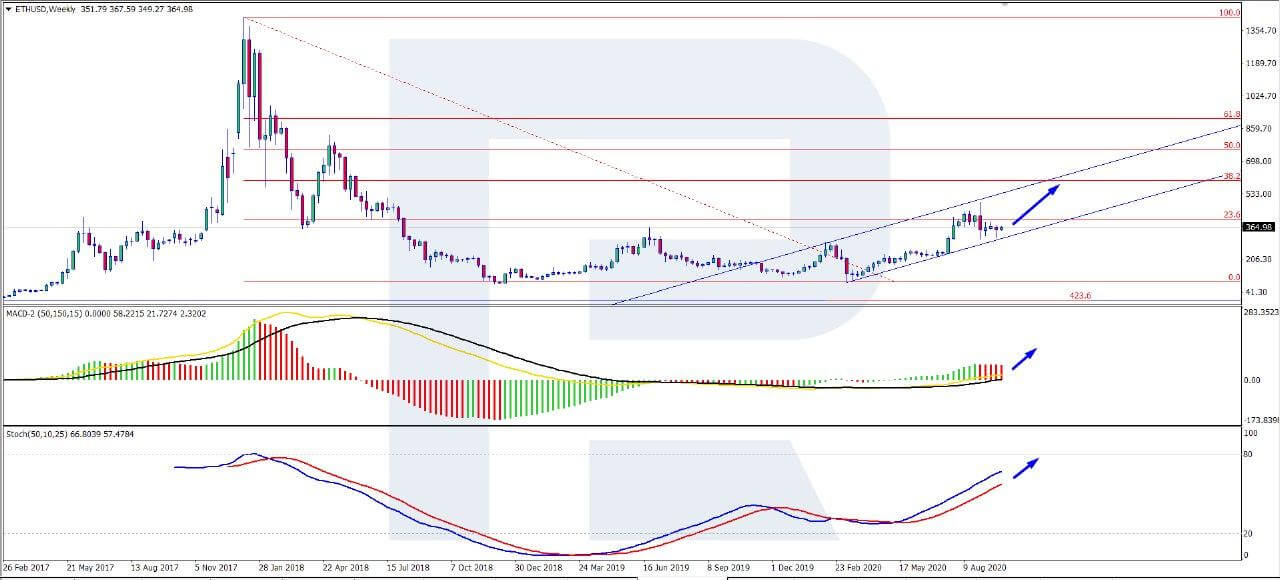
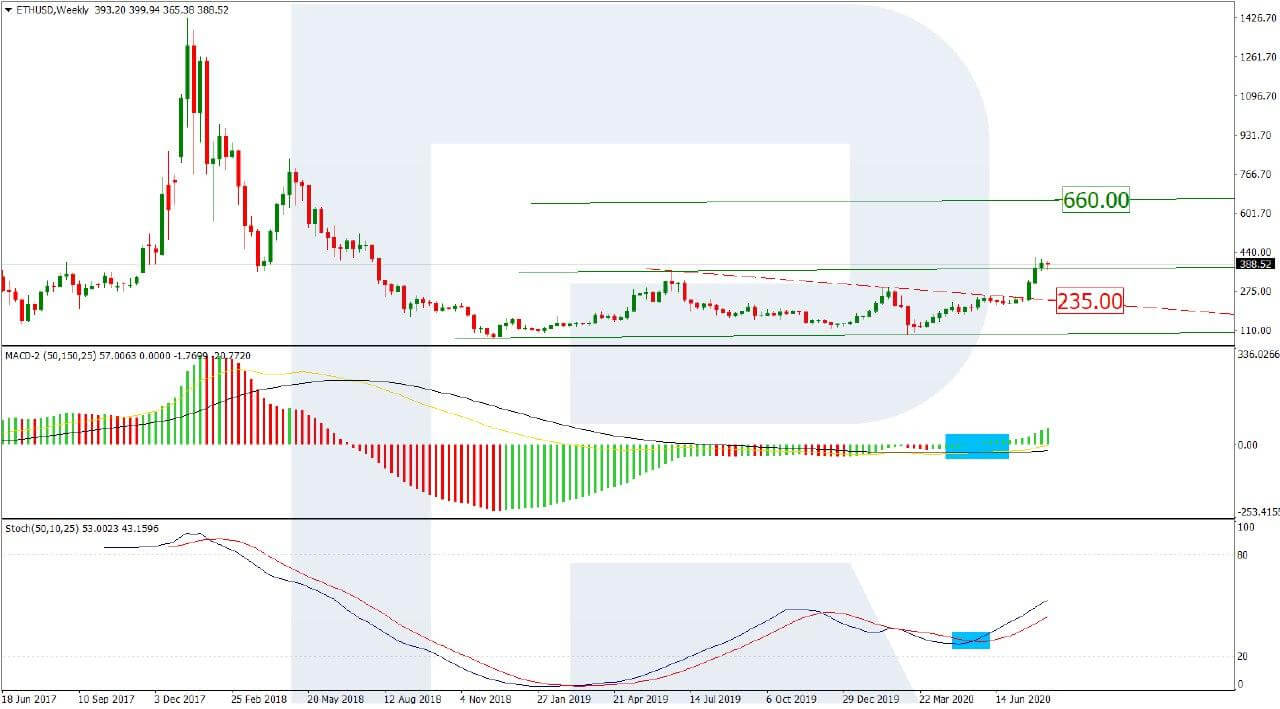
ETH 1-day:
Source: TradingView
The one-day ETH chart exhibited an uptrend from $84.92 to $105.5, followed by a minor uptrend from $105.5 to $134.9. A major downtrend from $220.7 to $146.5 was also seen. The resistances for the chart were found at $179.4 and $213.4, while the support lines held their ground at $118.3 and $102.2.
Bollinger Bands: The bands were diverging from each other and depicted a highly volatile period for the coin.
Awesome Oscillator: The closing lines were green and a bullish phase was predicted for ETH.
Chaikin Money Flow: The CMF was treading above the zero-line, indicating money flow into the market.
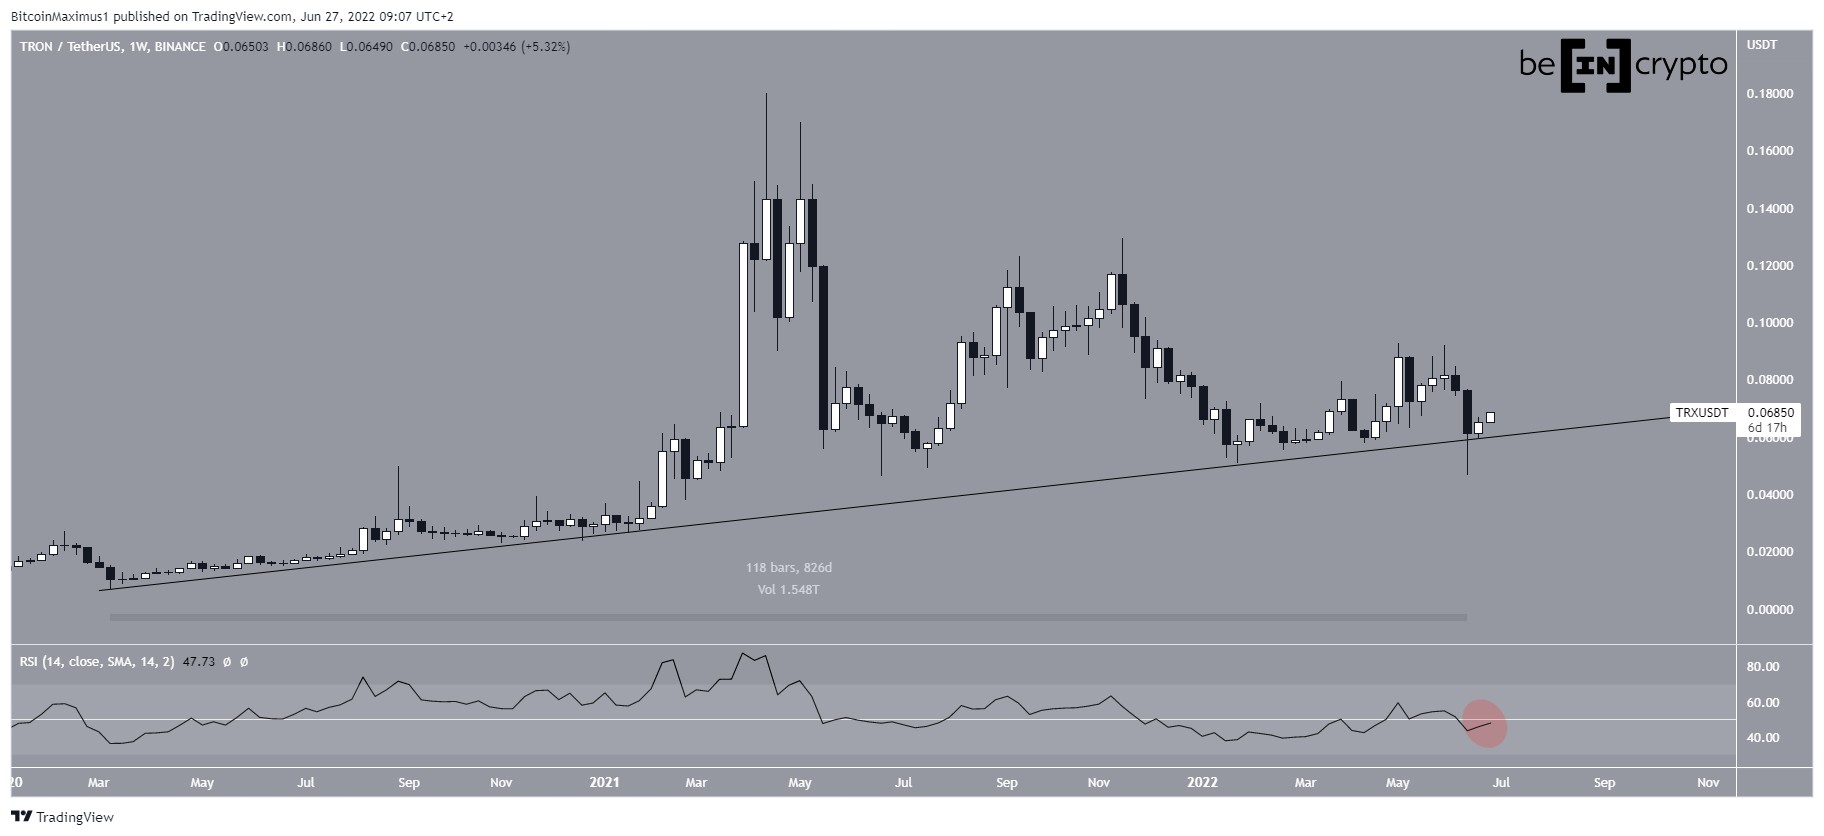
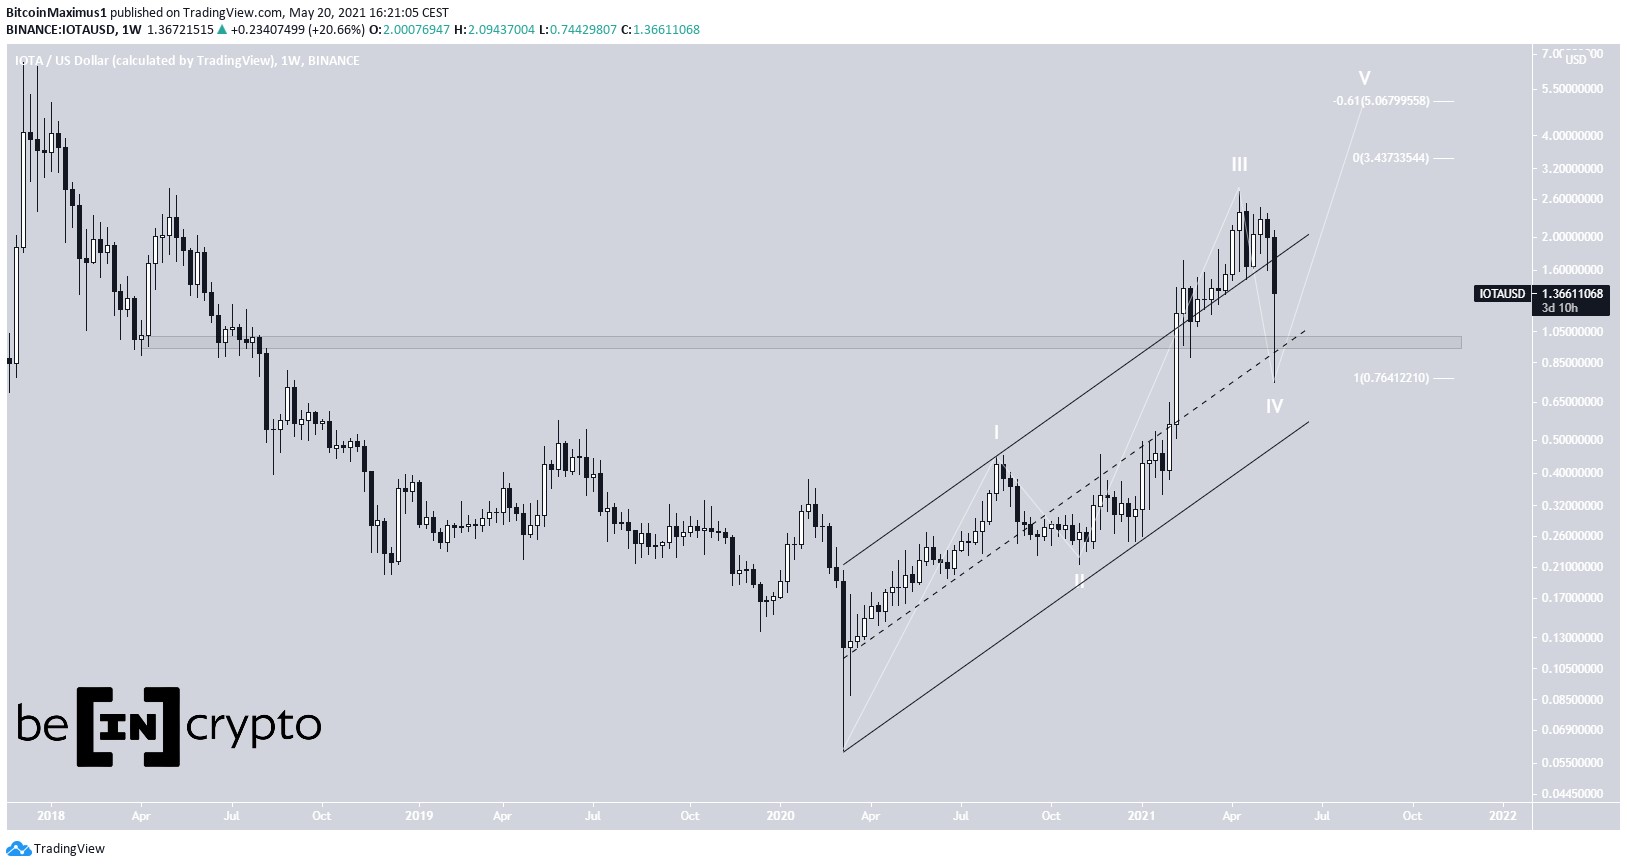
TRX 1-day:
Source: TraingView
An uptrend from $0.013-$0.023 and a downtrend from $0.037 to $0.020 was registered for the candlestick arrangement of the one-day TRX chart. The resistances for the chart was found at $0.039 and $0.030 along with the support points at $0.018 and $0.014.
Parabolic SAR: The dotted markers were below the candles, depicting a bullish future for the coin.
MACD: The MACD line was above the signal line, which further indicated that the coin was following a bullish trail.
Klinger Oscillator: The reading line was also above the signal line and predicted a bullish trend for TRX.
Conclusion:
The indicators exhibited strong bullish signals for both the digital assets. Additionally, ETH projected a potential price break-out patterns with expanding BB.
The post Ethereum [ETH] and Tron [TRX] Price Analysis: Bullish projection persists as ETH price break out patterns appeared first on AMBCrypto.
origin »Bitcoin price in Telegram @btc_price_every_hour
Ethereum (ETH) на Currencies.ru
|
|