2020-10-9 08:43 |
The EOS (EOS) price is trading very close to a support level that has been in place since April.
While a bounce seems more likely, a breakdown from this support area could cause a sharp drop due to the lack of additional support below it.
EOS Resistance and SupportThe EOS price has been decreasing since it reached a local high of $3.95 on Aug 16. It has been following a descending resistance line through the downward movement.
Currently, the price is trading very close to the $2.45 support area, above which it has been trading since April.
On Oct 7, the price seemingly initiated a breakout, moving well above the descending resistance line to reach a high of $2.97 — 20% above the opening price for the day. However, the higher prices could not be sustained and the daily candlestick was completed with a long upper wick.
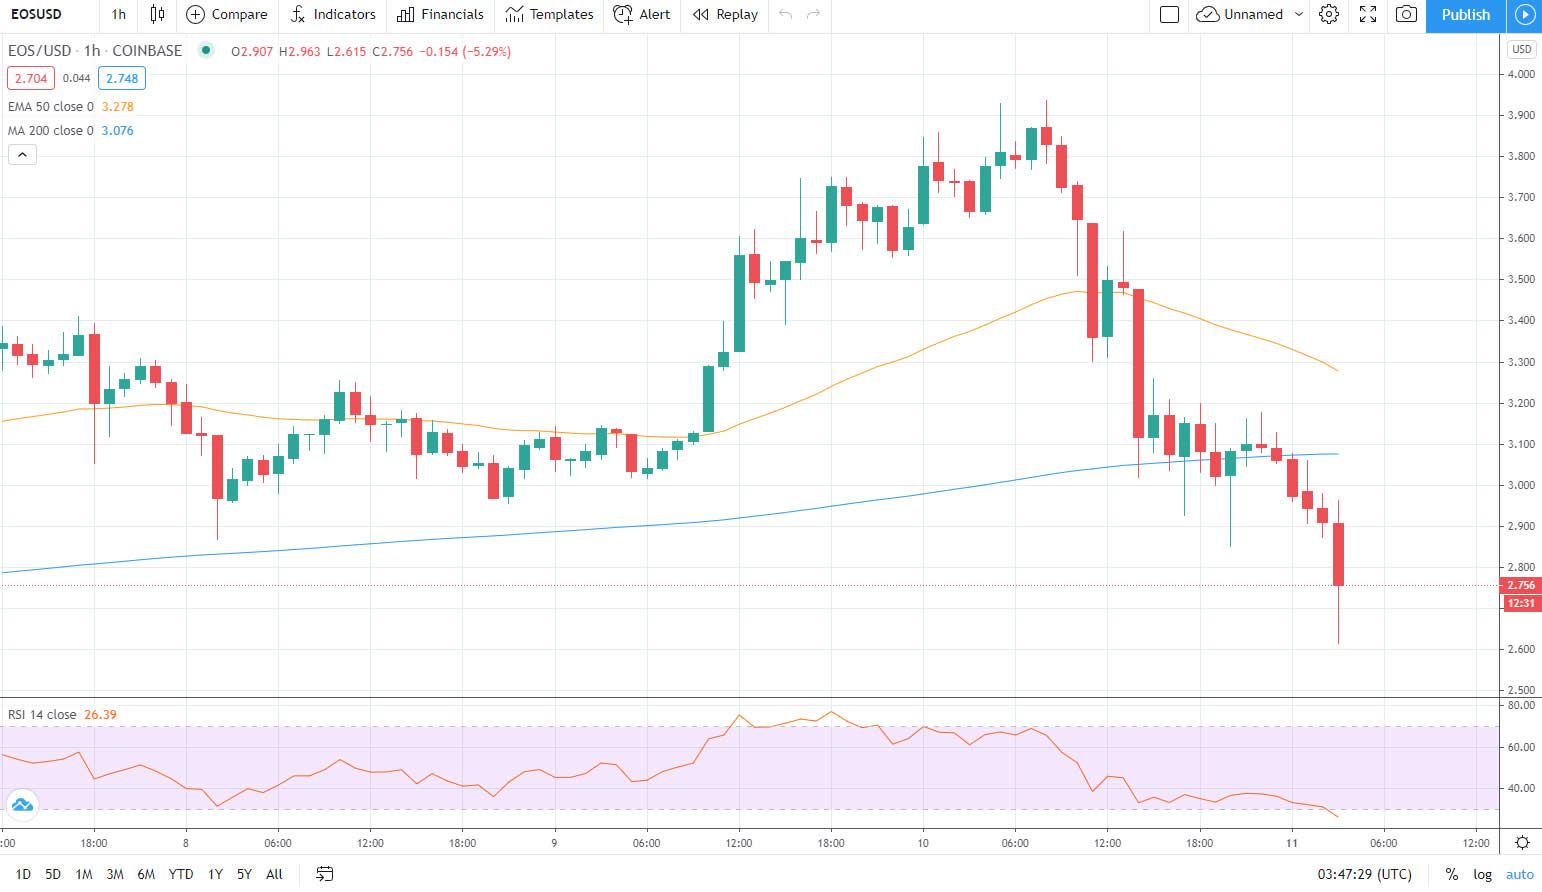
EOS Chart By TradingViewTechnical indicators in the daily time-frame are bullish. The Stochastic Oscillator has made a bullish cross and is moving upwards. The MACD has also begun to move upwards after generating bullish divergence but has yet to cross into positive territory.
However, the RSI is below 50 and has not generated any bullish divergence.
EOS Chart By TradingView Trading RangeThe 6-hour chart shows interesting movements in the range of $2.60-$2.90.
The $2.60 area initially acted as support, before a breakdown took the price towards $2.40. The ensuing upward move served to validate the $2.60 area as resistance and create a double bottom near $2.40.
During the aforementioned Oct 6 increase, the price reclaimed the $2.60 area and increased to validate the $2.90 area as resistance once more. At the time of press, EOS had returned to the $2.60 area, possibly to validate it as support again.
If the price manages to continue trading above $2.60, it would be very likely for another attempt at the $2.90 resistance area to ensue. This could also cause a breakout from the descending resistance line outlined in the previous section.
EOS Chart By TradingViewWhether the price breaks down below the support area or breaks out from the descending resistance line will likely determine the direction of the future trend.
A breakdown could take the price towards the next closest support at $2.10, while a breakout could take it to $2.90-$3.50 once more.
EOS Chart By TradingView EOS/BTCCryptocurrency trader @CryptoDonAlt outlined an EOS/BTC chart which shows a bullish engulfing candlestick, in what he believes is possibly the beginning of a new upward trend.
Source: TwitterSimilar to the EOS/USD pair, EOS/BTC increased considerably during Oct 7. However, the price met resistance at 25,600 satoshis and created a long upper wick before dropping once more.
The price movement for EOS/BTC seems more bearish than its USD counterpart. While the same pump caused a reclamation of a minor support level for EOS/USD, it only served to validate a resistance area for EOS/BTC.
Furthermore, the lack of support below the current price could allow for another drop towards 21,000 satoshis — levels not seen since 2017.
EOS Chart By TradingViewFor BeInCrypto’s Bitcoin analysis, click here!
Disclaimer: Cryptocurrency trading carries a high level of risk and may not be suitable for all investors. The views expressed in this article do not reflect those of BeInCrypto.
The post EOS Pumps but Fails to Sustain Higher Levels appeared first on BeInCrypto.
origin »Bitcoin price in Telegram @btc_price_every_hour
Lendroid Support Token (LST) на Currencies.ru
|
|