2020-10-21 22:15 |
The Vechain (VET) price has possibly broken out from a descending resistance line and validated it as support.
As long as the current support area holds, the price should continue moving upwards towards the resistance levels outlined below.
Breakout or Fakeout?The VET price has been declining since Aug 9, when a high of $0.22 was reached. It has been following a descending resistance line since.
VET reached a low of $0.011 on Sept 7 and seemingly began another upward move, only to get rejected and validate the $0.155 area as resistance before moving down to make another low.
After reaching a low of $0.096 on Oct 7, the price created a bullish engulfing candlestick and proceeded to break out from the descending resistance line ten days later. Despite this breakout, the price has not moved upwards much.
The main support and resistance levels are found at $0.105 and $0.155, in which a breakdown from the former could trigger a very sharp drop towards $0.008.
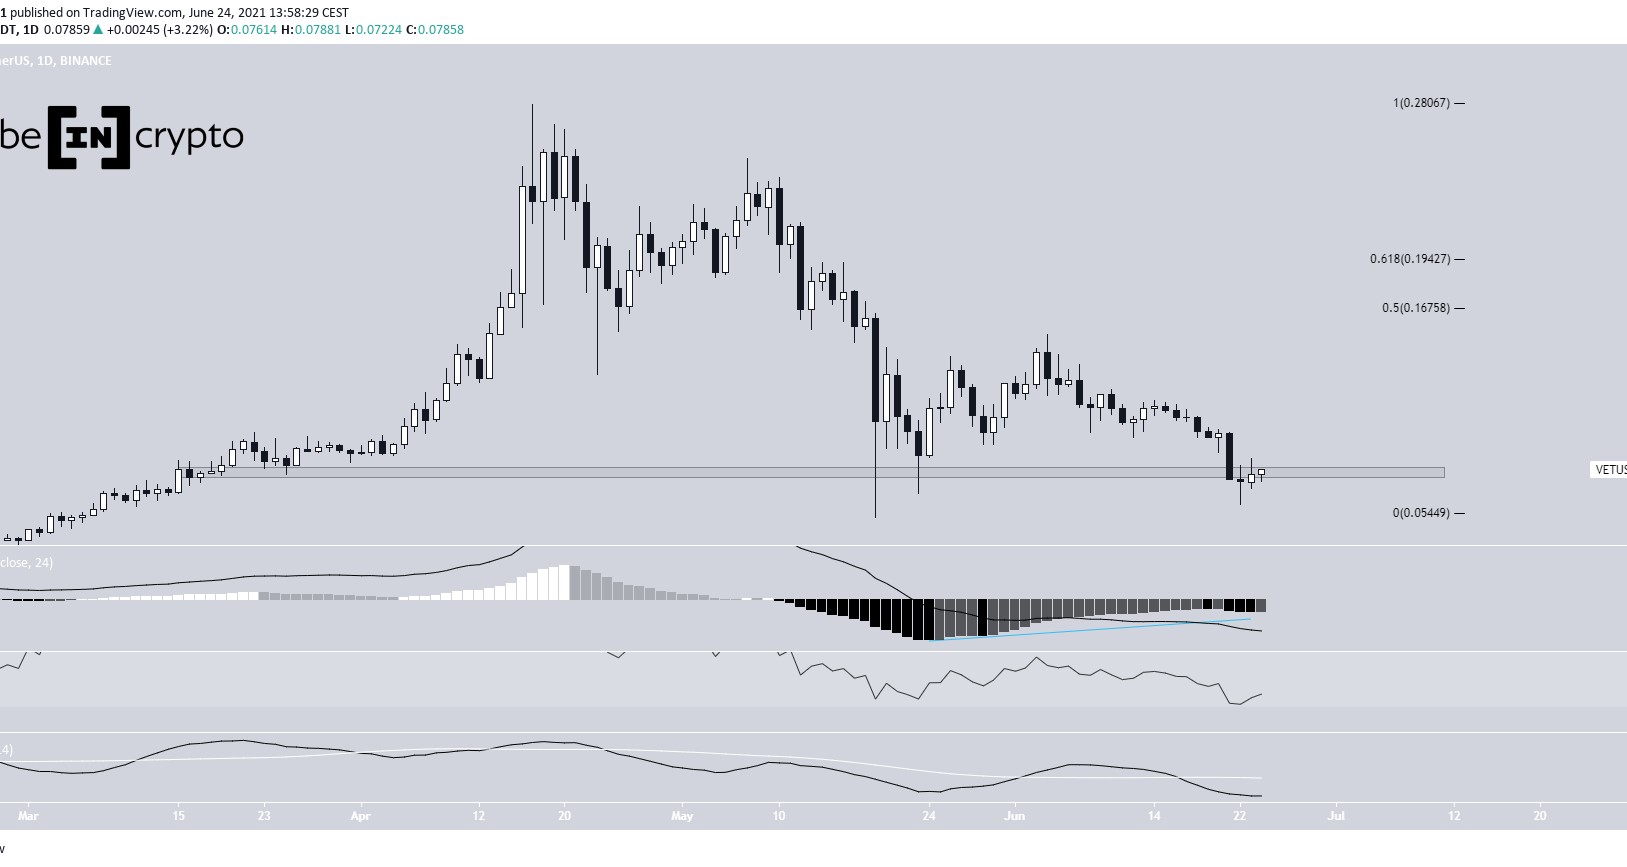
VET Chart By TradingView Continuation of Upward MovementTechnical indicators on the daily time-frame are bullish but don’t yet confirm the possibility of an upward move.
While the MACD has just crossed into positive territory, the RSI is still below 50. The stochastic Oscillator has made a bullish cross but has failed to continue moving upwards.
VET Chart By TradingViewThe 6-hour chart is slightly more bullish. Until now, VET has made two failed breakout attempts. Nevertheless, the RSI has shown strength during these failed attempts.
If the price creates another low and then validates the ascending support line, it should break out above the minor resistance area afterward.
VET Chart By TradingView VET/BTCCryptocurrency trader @Altcoinsherpa tweeted a VET price chart, stating that the price might have reached a bottom near 95 satoshis. She expects an upward movement towards 113 satoshis.
Source: TwitterThe price has been hovering around the 92 satoshi area since the tweet, validating it as support.
On the VET/BTC pair, the descending wedge is still clearly intact. However, the price is near the end of the pattern, and both the RSI and the MACD have formed significant bullish divergence.
Therefore, a breakout towards the 140 satoshi resistance area is the most likely option. This would also fit with the possible VET/USD breakout.
VET Chart By TradingViewFor BeInCrypto’s previous Bitcoin analysis, click here!
Disclaimer: Cryptocurrency trading carries a high level of risk and may not be suitable for all investors. The views expressed in this article do not reflect those of BeInCrypto.
The post Did VET Break Out or Are There More Lows to Come? appeared first on BeInCrypto.
origin »Bitcoin price in Telegram @btc_price_every_hour
VET (VET) на Currencies.ru
|
|