2023-11-21 07:52 |
BNB price gained momentum and climbed above the $250 resistance. It is up over 5% and the bulls could soon aim for a move toward the $300 level.
BNB price is moving higher above the $250 resistance. The price is now trading above $255 and the 100 simple moving average (4 hours). There is a major bullish trend line forming with support at $253.5 on the 4-hour chart of the BNB/USD pair (data source from Binance). The pair might continue to move up if there is a clear move above $268. BNB Price Jumps 8%These past few days, BNB price remained stable above the $240 resistance. The bulls stepped in and were able to clear a major hurdle at $250. It opened the doors for more upsides above $255.
BNB gained traction and climbed above $260. It is up over 5% and outperforming both Bitcoin and Ethereum. A new multi-week high is formed near $267.9 and the price is now consolidating gains. It is above the 23.6% Fib retracement level of the upward move from the $238.9 swing low to the $267.9 high.
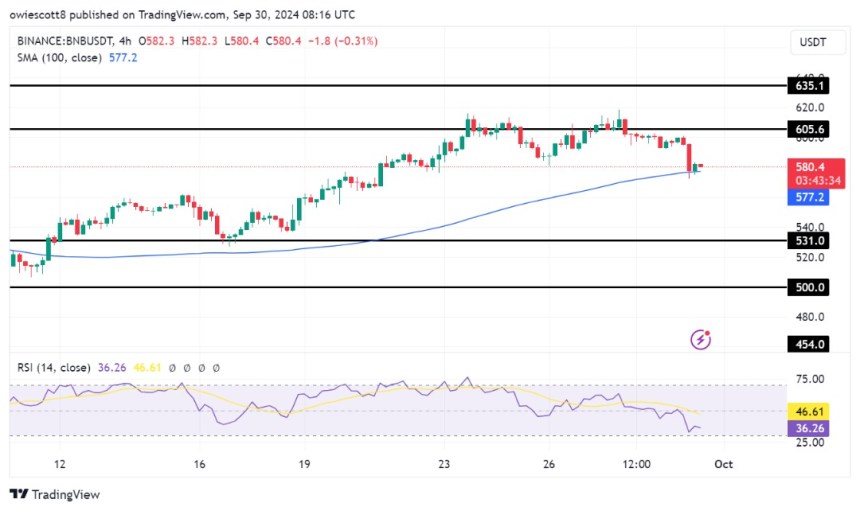
BNB is also trading above $255 and the 100 simple moving average (4 hours). Besides, there is a major bullish trend line forming with support at $253.5 on the 4-hour chart of the BNB/USD pair.
Source: BNBUSD on TradingView.com
If there is a fresh increase, the price could face resistance near the $265 level. The next resistance sits near the $268 level. A clear move above the $268 zone could send the price further higher. In the stated case, BNB price could test $280. A close above the $280 resistance might set the pace for a larger increase toward the $300 resistance.
Downside Correction?If BNB fails to clear the $265 resistance, it could start a downside correction. Initial support on the downside is near the $260 level. The next major support is near the $255 level.
The main support sits at $253 or the trend line. It is close to the 50% Fib retracement level of the upward move from the $238.9 swing low to the $267.9 high. If there is a downside break below the $253 support, the price could drop toward the $245 support. Any more losses could initiate a larger decline toward the $238 level.
Technical Indicators
4-Hours MACD – The MACD for BNB/USD is gaining pace in the bullish zone.
4-Hours RSI (Relative Strength Index) – The RSI for BNB/USD is currently above the 50 level.
Major Support Levels – $260, $255, and $253.
Major Resistance Levels – $265, $268, and $280.
origin »Bitcoin price in Telegram @btc_price_every_hour
Binance Coin (BNB) на Currencies.ru
|
|