Bitcoin Price Chart: Technical Indicator Gives 5th Ever Parabolic Signal

2019-5-21 03:01

While Bitcoin price is struggling with overhead resistance at the moment and taking a much needed breather from its bullish rally that began in early April with a $1,000 green candle, the cryptocurrency may have a lot more parabolic momentum left, according to one specific technical indicator.

The technical indicator in question has just given its fifth ever “parabolic” signal on the daily, with the previous four times resulting in massive, sustained price increases in the leading cryptocurrency by market cap. Should the indicator be correct, another powerful parabolic run might just be days away.

Top Goon X Indicator Signals Bitcoin Price to Go Parabolic Once Again

Bitcoin has a strong penchant for going parabolic once the emerging financial asset starts to pick up bullish momentum. Due to how scare the asset is, FOMO, and the speculation fueling violent volatility, Bitcoin price can rise and fall rapidly without ever taking a pause.

These unique conditions help Bitcoin price to skyrocket, as was seen in December 2017 when Bitcoin hit its all-time high price of $20,000 before the bubble popped and a bear market followed.

Related Reading | Analyst: Bitcoin Price Rally Targets Between $12K and $22K Based on BitMEX History

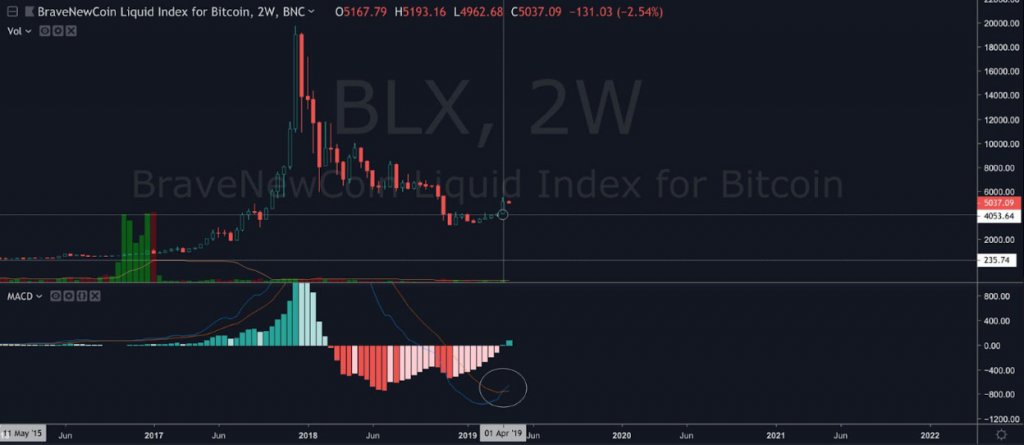
Prior to that highly-publicized parabolic rise, a technical indicator called the Top Goon X had given its fourth “parabolic” daily signal. Before that, the indicator signaled three parabolic spikes between 2012 and the height of the 2013 Bitcoin bubble.

The indicator thus far has been correct four out of four times, and the arrows indicated on the chart clearly demonstrate that the signal preceded a massive parabolic rise, taking the price of Bitcoin significantly higher in a short period of time. In fact, each time it occurred, Bitcoin set a new all-time high in the weeks following.

According to the creator of the technical indicator, the Top Goon X, TradingView author NebraskaGooner says that the tool just gave its fifth ever daily “parabolic” signal.

#Bitcoin

Top Goon X has only ever given the "Parabolic" daily signal 5 times.

Those 5 times are marked with an arrow on this chart. pic.twitter.com/8CQKgmgcK2

— NebraskanGooner (@nebraskangooner) May 19, 2019

Since the start of April, the asset has already gone parabolic, rising from $4,200 to over $8,000 in less than 40 days. But the signal triggered only after the initial parabolic spike, suggesting that Bitcoin price has a lot further to climb in 2019.

Bitcoin’s ability to go parabolic is both a blessing and a curse for crypto investors, as such a sharp and powerful rise can bring investors gains unheard of in most financial markets, but when that parabola breaks, Bitcoin and other cryptocurrencies typically fall 80% or more.

Related Reading | Why The Next Bitcoin Bull Run Could Eclipse The Last Crypto Bubble

The emerging asset class, despite its short history, is extremely cyclical in nature, with the most recent bear cycle starting to flip bullish now that Bitcoin reached its bear market bottom and reversed, painting a golden cross, and reviving interest across the market.

Featured image from Shutterstock

The post Bitcoin Price Chart: Technical Indicator Gives 5th Ever Parabolic Signal appeared first on NewsBTC.

Similar to Notcoin - Blum - Airdrops In 2024

origin »

Bitcoin (BTC) на Currencies.ru

$ 66529.72 (-0.70%)
Объем 24H $35.269b
Изменеия 24h: -4.83 %, 7d: -5.85 %
Cегодня L: $66186.49 - H: $69643.92
Капитализация $1311.561b Rank 1
Цена в час новости $ 7875.55 (744.76%)

technical indicator bitcoin parabolic price signal ever

technical indicator → Результатов: 52


Bitcoin [BTC]: Coin’s rally has begun, claims Peter Brandt on the basis of past data, technical indicator

Peter Brandt, an old school trader and author of “Diary of a Professional Commodity Trader,” posted a tweet suggesting that Bitcoin’s rally might have begun. Brandt tweeted, “The last time Factor’s benchmark weekly MA was in the current profile of turning from down to up was in Nov 2015 just as $BTC began its move […] The post Bitcoin [BTC]: Coin’s rally has begun, claims Peter Brandt on the basis of past data, technical indicator appeared first on AMBCrypto.

2019-5-4 22:30


Technical Indicator Suggests Tether Trouble Has Put an End to Bitcoin Rally

This week, a scandal involving Bitfinex and Tether parent company iFinex being accused by the New York Attorney General’s office of misappropriating funds has shaken up the cryptocurrency market. Bitcoin and other cryptocurrencies have rallied in recent months, however, the latest negative news surrounding the leading stablecoin on the market has been enough to cut.

2019-4-30 03:01


Bitcoin / USD Technical Analysis: Critical Round

Bitcoin has a bullish short-term outlook, with the BTC / USD pair regaining bullish momentum above the $5,100 level The four-hour time frame shows a bearish head and shoulders pattern The Ichimoku indicator on daily time frame is showing that the $5,200 level is an important pivot Bitcoin / USD Short-term price analysis Bitcoin has […] The post Bitcoin / USD Technical Analysis: Critical Round appeared first on Crypto Briefing.

2019-4-18 17:12


Bitcoin Price: Key Technical Indicator Shows BTC Surging to $5,500

Throughout the past three months, the bitcoin price has flirted with the $4,200 resistance level, often struggling to maintain momentum above the key $4,000 mark. Several traders have demonstrated concerns over the extended period of stability demonstrated by bitcoin because, in late 2018, the cryptocurrency recorded a drop of around 50 percent following three months of stagnation in the $6,300 to $6,500 range.

2019-3-24 21:30


Bitcoin Shorts Near Monthly High and it Could Trigger a Major Price Movement

Bitcoin shorts have increased significantly in recent weeks to a monthly high, an indicator that may suggest a decline in the confidence of investors in the dominant cryptocurrency. Shorts remain an unconvincing indicator of the sentiment in the cryptocurrency market because the take of analysts on the impact of short contracts on the price of Bitcoin differs quite regularly.

2019-3-13 21:32


Аналитики Bloomberg прогнозируют краткосрочное ралли биткоина

Ключевые технические параметры сигнализируют о том, что цена биткоина (BTC), вероятно, уже нащупала «дно» и стремится к краткосрочному повышению. Такое мнение выразили аналитики Bloomberg. Показатель GTI Global Strength Technical Indicator составляет 35.

2019-1-25 21:40


Bloomberg: Цену биткойна ожидает краткосрочное ралли

Скоро цена на биткойн начнет краткосрочный цикл повышения, считают аналитики Bloomberg. По их мнению, на это указывают низкое значение показателя GTI Global Strength Technical Indicator и торговля на уровне чуть выше нижней границы индикатора GRI VERA Trend Signals.

2019-1-25 21:13


Фото:

Bitcoin Value Indicator Says Price ‘Still Overbought’ But Bottom ‘Near’

The Bitcoin price bottom is “near,” but the largest cryptocurrency still shows signs of being “overbought,” new research released October 1 claims. Understanding ‘What’s Going On’ In the latest installment of his ‘Bitcoin Value Indicator,’ tech commentator Hans Hauge brought together multiple factors to create an overview of the Bitcoin price which he says allows investors to “understand what’s going on.

2018-10-3 23:00


Why Analysts See Bitcoin Breaking Out of the $8,800 Resistance Level Very Soon

Crypto analysts and investors have established the $8,800 resistance level as a short-term target for Bitcoin, based on the optimistic technical indicators of the dominant cryptocurrency. Bitcoin Rally Ahead? Most of the predictions on the short-term rally of Bitcoin originated from data provided by RIG trend lines — an indicator that combines the Relative Strength.

2018-9-28 09:00