2019-4-8 16:00 |
Bitcoin price completed an impressive week last week with gains of 30%, rising from lows of $4053 to weekly highs of $5345. With many calling an end of the bear market, we take a looking at the outlook for the market going into the second week of April.
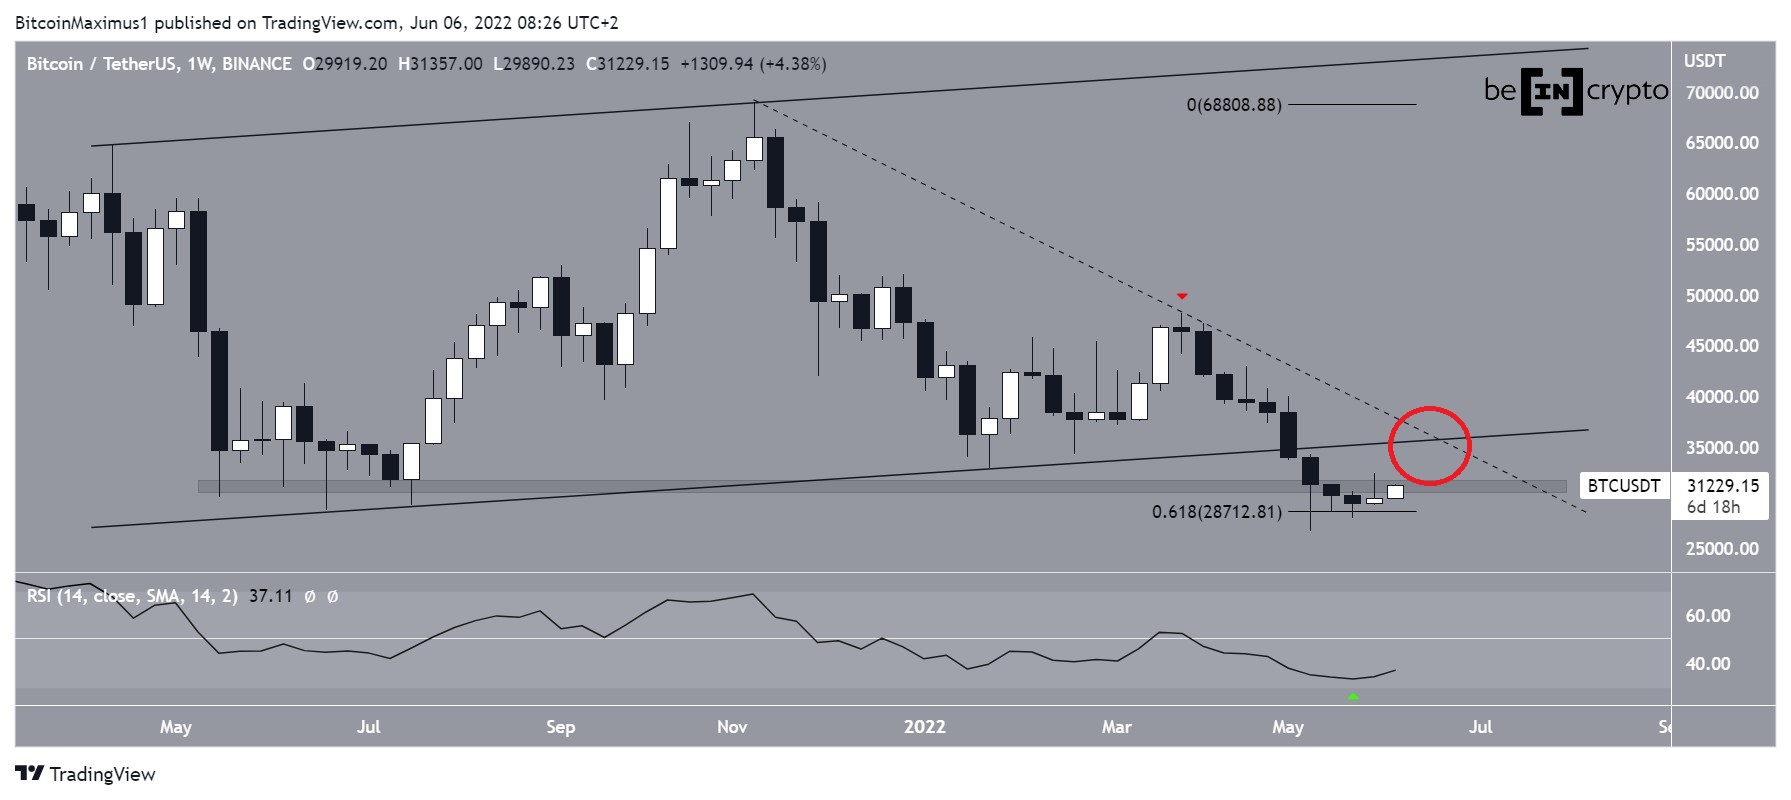
Weekly ChartThe weekly bitcoin price 00 chart shows that BTC/USD completed an impressive seventh consecutive weekly green candle, accompanied by the highest volume of 2019.
The MACD remains crossed bullish and is rapidly moving towards being positive, having been bearish since mid-May 2018.
There is still a void in VPVR, which illustrates the price where volume traded. This suggests that Bitcoin still has some room to run higher, which is something we have previously discussed with the $5k price range being open ground.
The 50-week moving average capped the initial attempt to break out of the bull market in mid-2015 before pressing price back down to the 200 week moving average support. There is certainly a case for expecting something similar in 2019.
Should this occur, the 200 WMA would most likely lie around $3800. This would mean a 78.6% retracement of the move we’ve seen in 2019. But a move like this would likely take some time to play out.
Daily ChartLooking at the daily chart early on Monday, bitcoin price made an attempt to break higher, which has since been pushed back down into a bearish shooting star candle, which is in the process of forming on the daily candle. There is however, plenty of time for the bulls to find their feet with the US markets yet to open.
The MACD continues to trend higher above zero, but there are signs of the bullish momentum fading, with a lower high being printed on the histogram. Volume is beginning to return to levels seen ahead of the breakout. Price appreciation on decreasing volume is generally considered a bearish sign.
Should BTC/USD look to retrace in the short term, the 50% Fibonacci level of $4355 would most likely be the area of interest for the bulls, with the breakout level and 61.8% retracement of $4120 being the next target.
1-Hour Order Book AnalysisLooking at the order book, bitcoin has a block of buying interest around the $4800 price point. And on lower time frames, we can see that there is still a generally bullish ascending triangle pattern in the price action, which is positive ahead of the US close with a lack of sizable sell orders visible overhead.
Looking Ahead
Despite the selloff on Monday morning, bitcoin price has managed to maintain above $5100.
Holding ground above the $5,100 handle early in the week will be key to continuing bullish momentum and any attempt to explore the remaining price volume void in the VPVR.
Although it seems unlikely at this stage, a break to the upside could see BTC quickly push on towards the $5500 – $5700 price range, enticing new buyers into the market.
A breakdown in price momentum would bring those who have already taken profit back into the market, alongside new prospective buyers. So it would be reasonable to expect a decent bounce back up to the $5,000 level quite quickly.
Trade Bitcoin (BTC), Litecoin (LTC) and other cryptocurrencies on online Bitcoin forex broker platform evolve.markets.
To get receive updates for the writer you can follow on Twitter (@filbfilb) and TradingView.
The views and opinions of the writer should not be misconstrued as financial advice. For disclosure, the writer holds Bitcoin at the time of writing.
Images courtesy of Shutterstock, Tradingview.com, Tensor Charts
The post Bitcoin Price Analysis: BTC/USD Caps 7-Week Winning Streak appeared first on Bitcoinist.com.
origin »Bitcoin price in Telegram @btc_price_every_hour
Bitcoin (BTC) на Currencies.ru
|
|