2019-8-27 20:14 |
Since the recent drop from $11,000 t0 $9,800 as outlined in my previous analysis on BTC, price levels have created an asymmetrical triangle and will see a breakout next week.
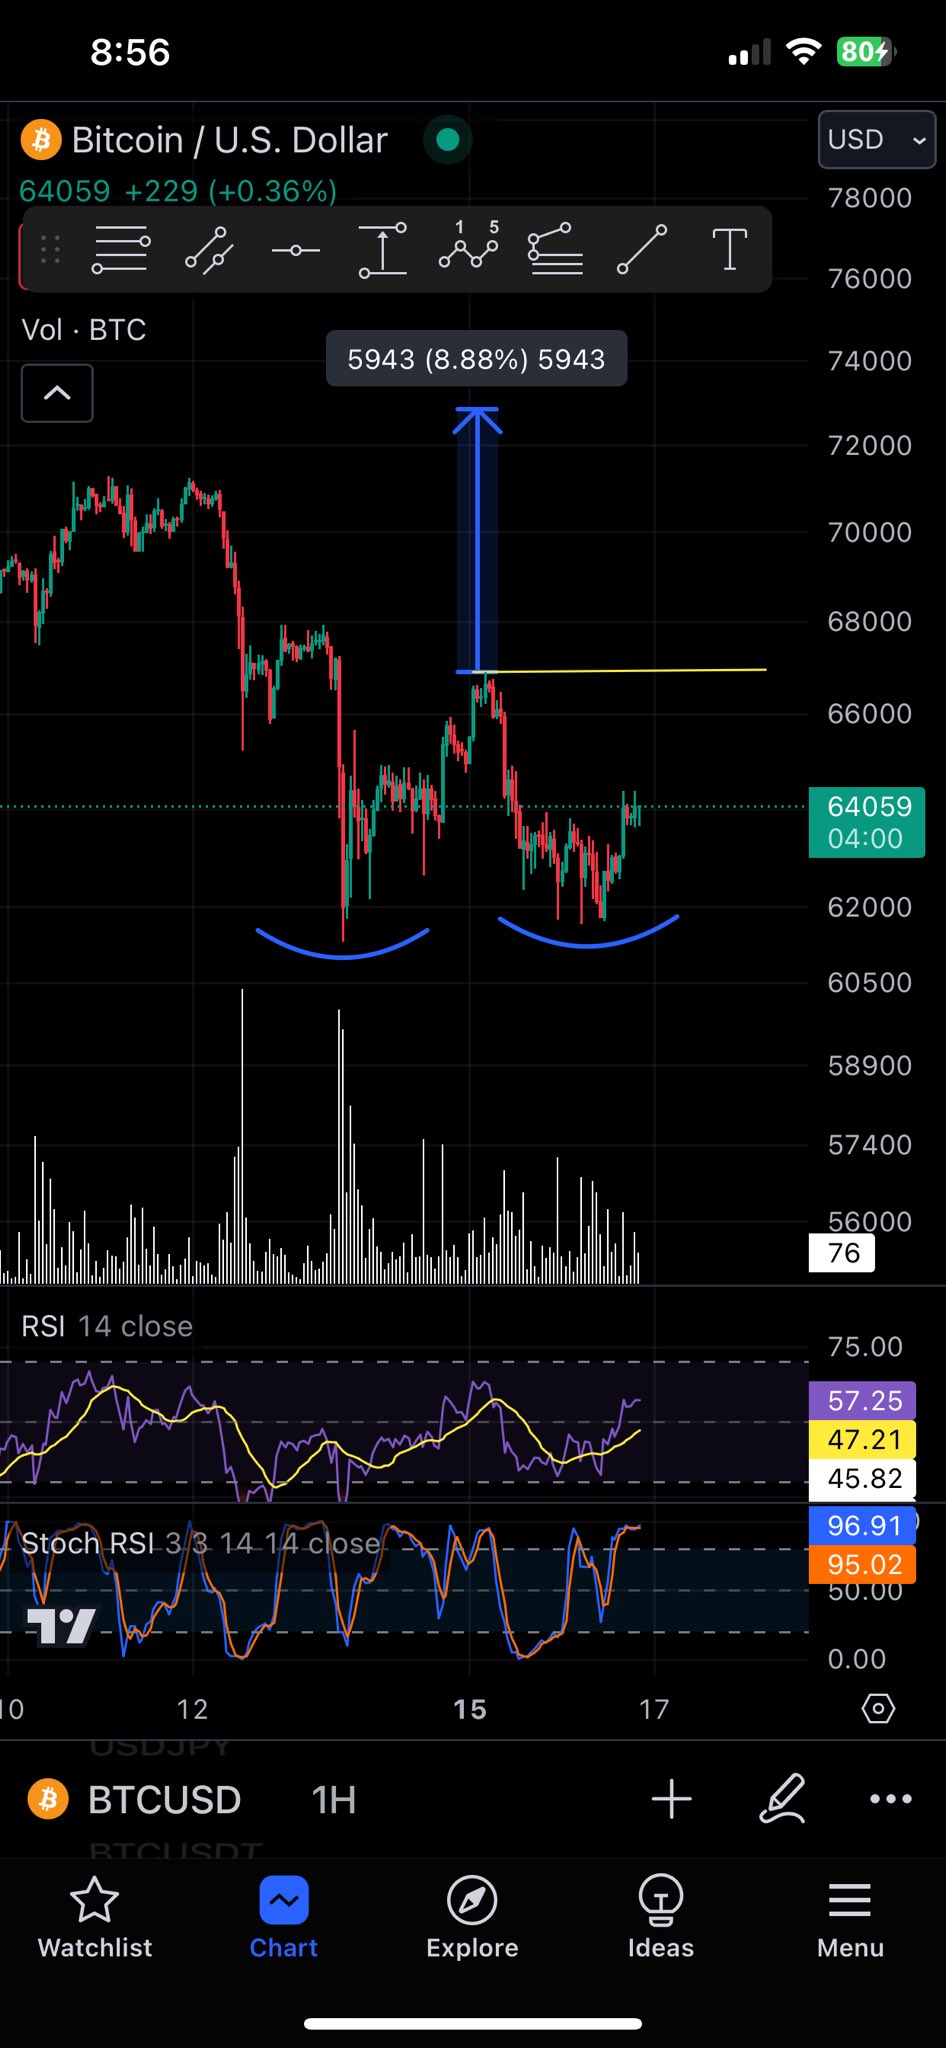
Bitcoin 1-Hour AnalysisOn the 1 hour chart for XBT/USD, we can see the asymmetrical triangle highlighted after the breakdown from the rising wedge as mentioned in my previous analysis on Bitcoin. An attempted breakout to the upside took around 24 hours before writing this analysis but was quickly met with large selling pressure. Since then, a clear spike to the upside propelling Bitcoin up to $10,800 took place. Price action now trades sideways resting on the 200 EMA and looks poised for a drop back to POC (Point of Control) at $10,111.
Such a glaring rejection of the attempted breakouts leads me to believe we could see a break-down as bulls struggle to gain any momentum. Large wicks met with selling pressure usually indicates the breakout is unsustainable and is essentially going to fuel a further drop.
I’m expecting price levels to re-visit the 0.382 Fibonacci level at $9,650 before forming a new uptrend. Providing a clear bounce plays out at this price point, key resistance at $11,100 will likely be broken, and result in a new short-term uptrend that will likely last for multiple weeks. Price levels struggling to gain higher than the 500 MA at $10,800 is a bearish sign.
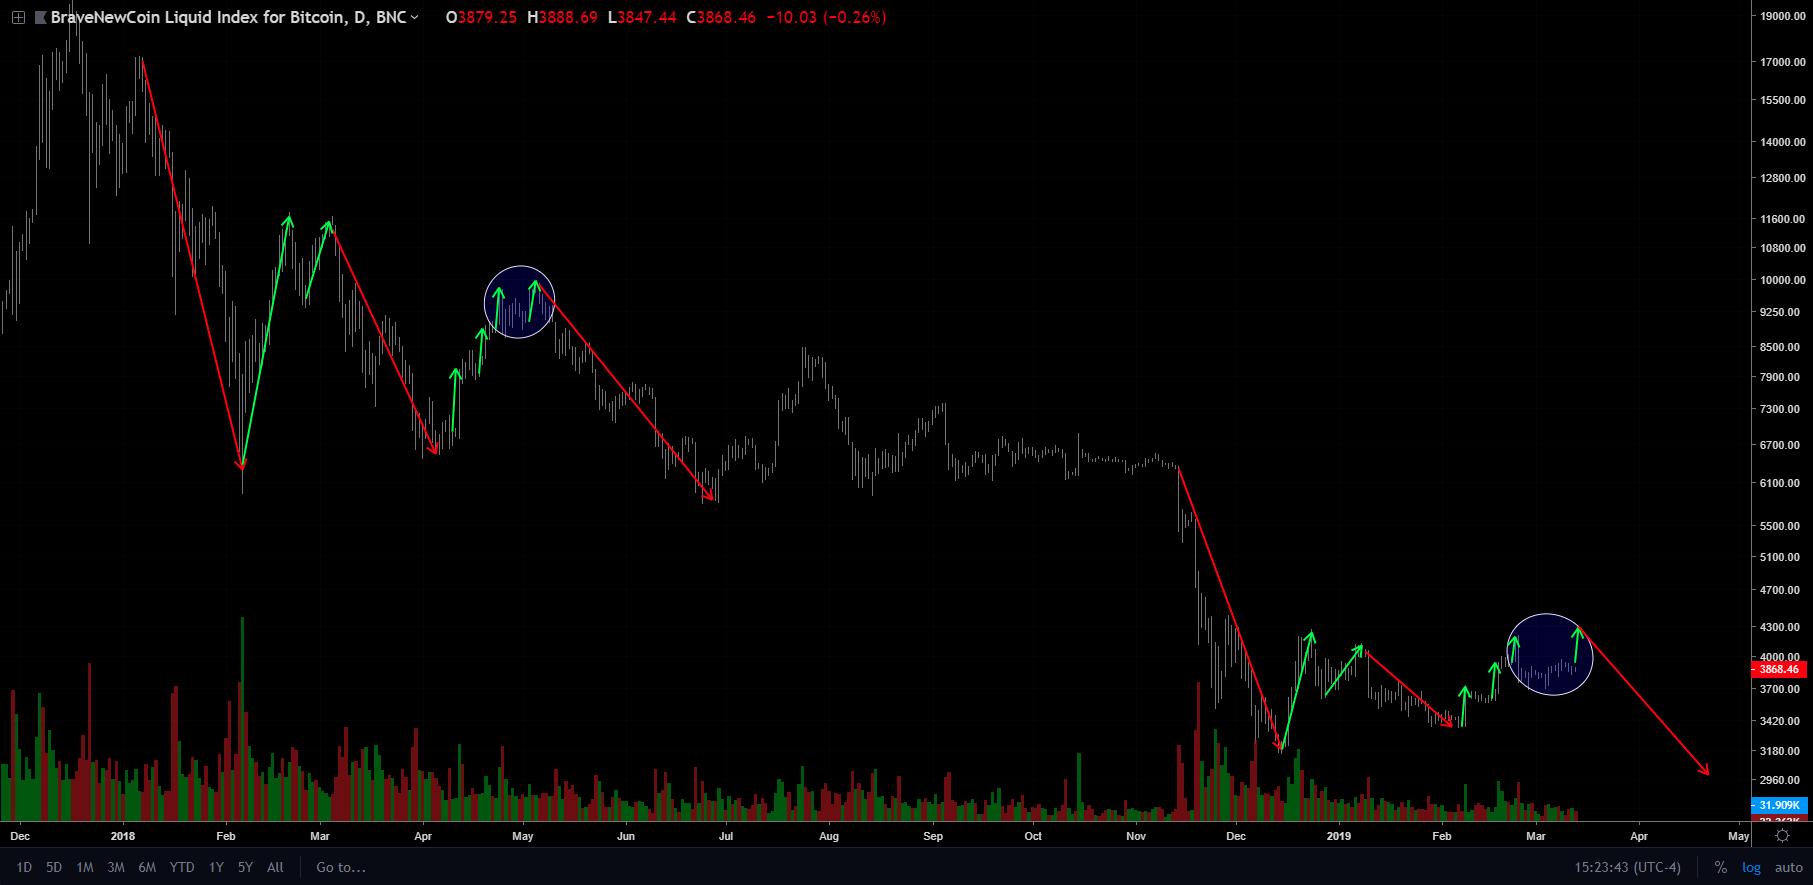
Bitcoin 4-Hour AnalysisOn the 4 hour chart for XBT/USD, we can see the 500 MA cutting right through the current market price. This indicates that Bitcoin has undergone a period of sideways consolidation within the last few months despite the volatile range created. Bitcoin has only just created a lower low and the peaks are all within close proximity of each-other value-wise, thus showing sideways movement. We know that a volatile consolidation range of between $14,000 and $9,800 will likely be met with an explosive breakout.
Volume MA currently trades around the all-time low for the visible chart time-frame. If volume levels don’t rise soon Bitcoin price will likely see another drop which could create a lower low on the 4-hour chart, anywhere between $8,800 and $8,100.
If price levels drop below $8,100 it’s wise to assume the trend is bearish and to be more cautious when taking long positions. For now, the sentiment is very much still bullish and largely depends on whether or not enough volume will flood back into the market, similar to the volume levels seen throughout May and June through to July.
Do you think Bitcoin price will break past $11,100 over the coming weeks? Please leave your thoughts in the comments below!
This article is strictly for educational purposes and should not be construed as financial advice.
Images via Bitcoinist Image Library, BTC/USD charts by TradingView
The post Bitcoin Price Analysis: $10,000 Sees Bulls Accumulating appeared first on Bitcoinist.com.
origin »Bitcoin price in Telegram @btc_price_every_hour
Bitcoin (BTC) на Currencies.ru
|
|