2020-11-16 11:44 |
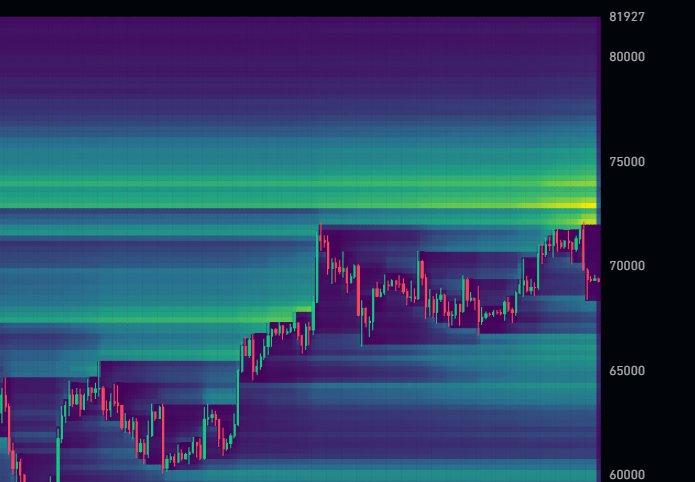
The Bitcoin (BTC) price increased incrementally during the week of Nov 9-16. Even though the price failed to reach a close above $16,000, it returned to validate the previous breakout level and has begun to increase once more.
During the week of Nov 9-16, BTC increased slightly, creating a small bullish candlestick with wicks on each side. The price reached a high of $16,494, but dropped shortly afterward and reached a close below $16,000.
Bitcoin Technical IndicatorsTechnical indicators do not yet show any weakness and there is no bearish divergence present. The Stochastic Oscillator made yet to make a bearish cross.
Nevertheless, the price is trading inside the important 0.768 Fib resistance level, which is found at $16,140. BTC has not yet reached a close above this level.
The next important resistance area would likely be found at $17,264, the 0.854 Fib retracement level.
BTC Chart By TradingView BTC Re-Tests Support LevelThe daily time-frame shows the importance of the $15,800 area, which acted as resistance until the Nov 12 breakout.
Since then, the area has turned to support and caused a long lower wick to be formed on Nov 14, a sign of buying pressure.
As long as the price is trading above this level, the possibility of continuation remains high.
BTC Chart By TradingViewIn the daily time-frame, technical indicators have not yet shown decisive weakness, but are relatively close to doing so:
The MACD has begun to lose its momentum but has not yet begun to decrease. The Stochastic Oscillator has not made a bearish cross but is not increasing either. The RSI has generated some bearish divergence but has not completed a swing failure top.The RSI occurrence is especially important since a decrease below 70 would both complete the failure swing top and cause a cross from overbought territory back below 70 — a bearish signal.
BTC Chart By TradingView Short-Term MovementIn the shorter-term one-hour chart, the price has broken out from a descending resistance line that had been in place since the Nov 13 highs.
Afterward, BTC swiftly moved above the 0.618 Fib resistance level, a strong sign that makes the increase more likely to be the beginning of a new upward move than it is to be corrective.
While a short-term decrease could occur, possibly to validate the descending resistance line, it seems likely that Bitcoin will resume its upward movement.
BTC Chart By TradingView ConclusionAs long as BTC is trading above the $15,800 area, which has now turned to support, the possibility of continuation remains high.
For BeInCrypto’s previous Bitcoin analysis, click here!
Disclaimer: Cryptocurrency trading carries a high level of risk and may not be suitable for all investors. The views expressed in this article do not reflect those of BeInCrypto
The post Bitcoin Continues Upward Move After Validating Breakout Level appeared first on BeInCrypto.
origin »Bitcoin price in Telegram @btc_price_every_hour
Level Up Coin (LUC) на Currencies.ru
|
|