2023-10-25 07:01 |
Bitcoin price started a downside correction from the $35,000 resistance. BTC could start a fresh increase unless there is a move below $32,800.
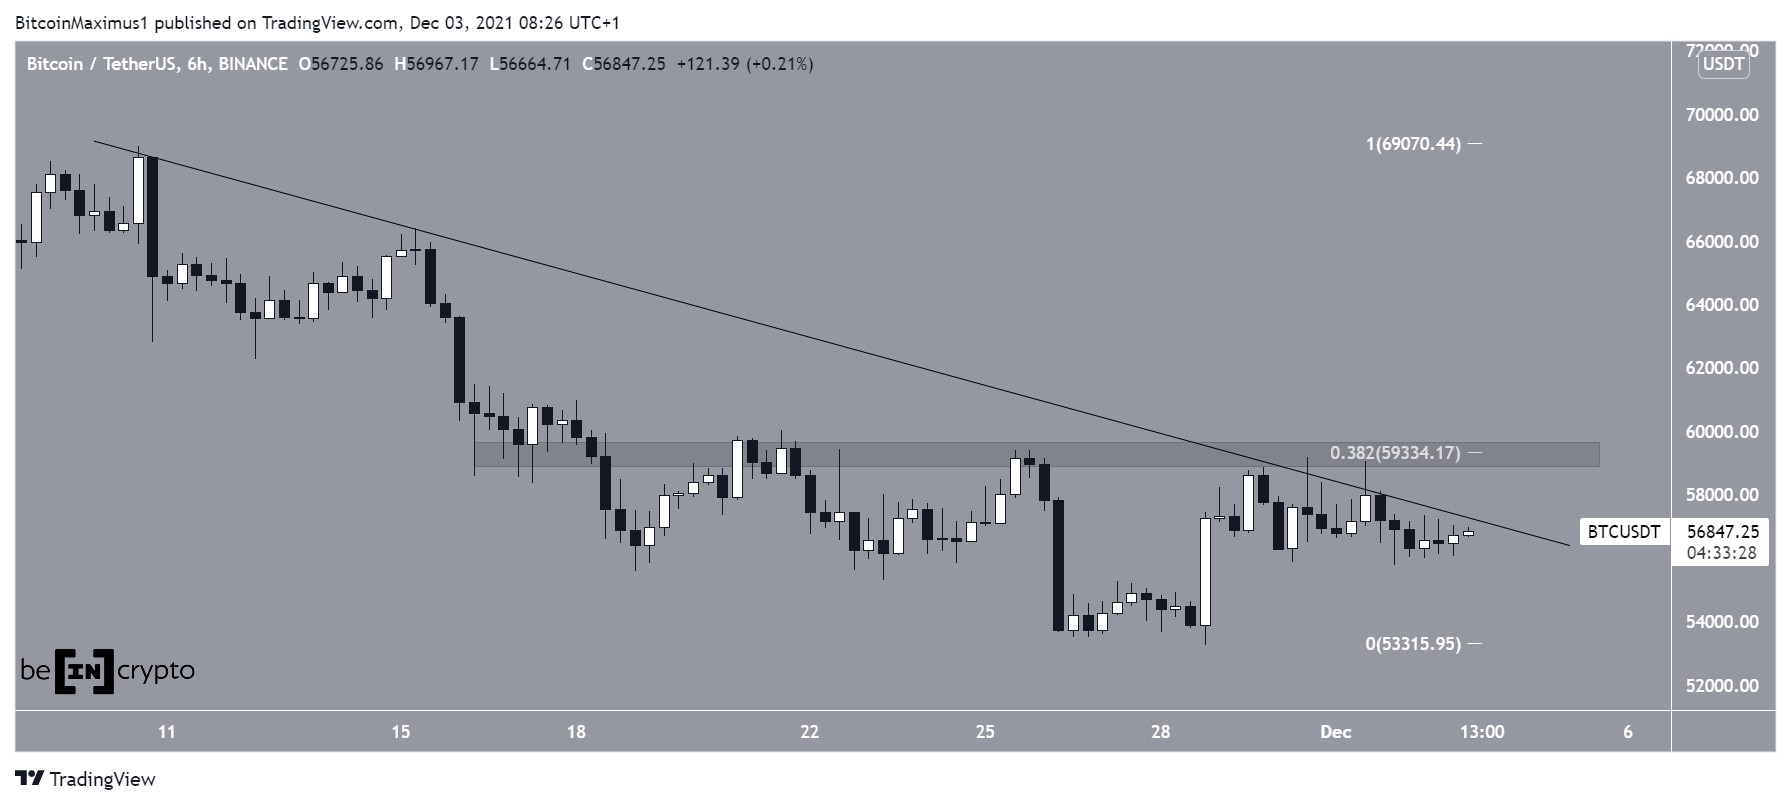
Bitcoin rallied toward the $35,000 resistance before the bears appeared. The price is trading above $33,200 and the 100 hourly Simple moving average. There is a key breakout pattern forming with resistance near $34,050 on the hourly chart of the BTC/USD pair (data feed from Kraken). The pair could correct lower toward the $33,000 zone before it starts a fresh increase. Bitcoin Price Corrects GainsBitcoin price rallied over 15% after there was speculation of spot ETF being listed DTCC. BTC surged toward the $35,000 resistance zone before the bears appeared.
A new multi-week high was formed near $35,225. Recently, the price started a downside correction below the $34,500 level. There was a move below the 23.6% Fib retracement level of the upward move from the $29,694 swing low to the $35,225 high.
Bitcoin is now trading above $33,200 and the 100 hourly Simple moving average. There is also a key breakout pattern forming with resistance near $34,050 on the hourly chart of the BTC/USD pair. The triangle support is close to the 50% Fib retracement level of the upward move from the $29,694 swing low to the $35,225 high.
On the upside, immediate resistance is near the $34,050 level. The next key resistance could be near $34,800. The main resistance is now forming near the $35,000 zone.
Source: BTCUSD on TradingView.com
A clear move above the $35,000 barrier might send the price toward the $36,200 resistance. The next key resistance could be $37,000. Any more gains might send BTC toward the $38,000 level in the coming days.
More Losses In BTC?If Bitcoin fails to rise above the $34,050 resistance zone, it could continue to move down. Immediate support on the downside is near the $33,400 level.
The next major support is near the $32,800 level and the triangle trend line. If there is a move below the trend line support, the price may perhaps decline toward the $31,500 level in the coming sessions.
Technical indicators:
Hourly MACD – The MACD is now losing pace in the bullish zone.
Hourly RSI (Relative Strength Index) – The RSI for BTC/USD is now above the 50 level.
Major Support Levels – $33,400, followed by $32,800.
Major Resistance Levels – $34,050, $34,800, and $35,000.
origin »Bitcoin price in Telegram @btc_price_every_hour
Bitcoin (BTC) на Currencies.ru
|
|