2019-11-12 14:30 |
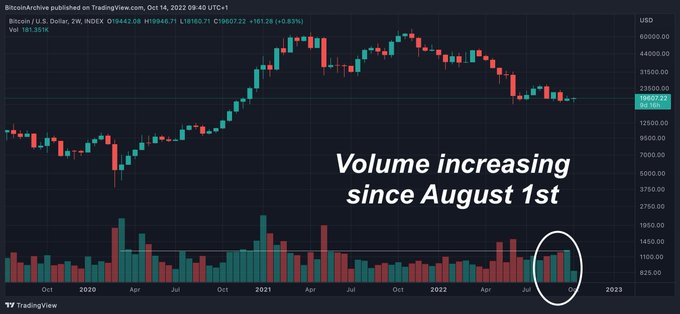
The Bitcoin market has recently surpassed the activity levels of late 2017, when BTC started its historical rally that shot prices to an all-time high above $19,900.
Futures Markets Take Over Spot TradingThis time, the BTC market has made a complete recovery from the low volumes in January. The biggest boost comes from the newly launched futures markets, and the heightened activity on BitMEX. The leading futures exchange saw open interest exceed $1 billion several times in the second half of the year.
According to a market commentator, Charles Edwards, Bitcoin’s 90-day volume recently broke as high as 40% above 2017’s peak levels. This, he says, ‘has powerful implications’.
Massive volume in Bitcoin
Guess what?
Things are not as they may seem.
Shrinking Spot market volume has been more than compensated for.
Futures have swallowed the Spot market. BTC 90 day Volume was recently 40% more than the 2017/18 peak.
This has powerful implications. pic.twitter.com/LXRoF9NXoG
— Charles Edwards (@caprioleio) November 11, 2019
The BTC spot market, which was a source of price discovery for years, has been supplanted by the larger, more agile futures market. Price discovery is happening both on BitMEX and Binance futures markets, as well as CME and Bakkt, which are attracting mainstream investors with cash-settled and physical delivered bitcoin futures.
Bitcoin and Tether Flows Signal End of RallyThe BTC market is also dependent on the interplay between exchange inflows and outflows. BTC movements to exchanges signal selling pressures. Tether (USDT) inflows however, are usually followed by a rally.
But the most effective combination for a bullish price move would be an outflow of BTC, while USDT liquidity grows. The “hodling” behavior on the side of whales and new funds to boost buying BTC positions.
1/ Combining net $USDT & net $BTC flows
Reading chart: Left axis is net $USDT flows – net $BTC flows. So, for example, a $100M tether inflow & $100M btc outflow equals +$200M (both are bullish). In reverse, $100M tether outflow & $100M btc inflow equals -$200M (both are bearish) pic.twitter.com/KsPEK3Y87N
— Ceteris Paribus (@ceterispar1bus) November 11, 2019
In the past few months, the flow profile signals a potential price slide, due to diminishing sources of new liquidity. The attitude to BTC is signalling a return to pessimism, with the Bitcoin fear and greed index moving down to “fear” territory at 39 points.
For BTC, almost all factors that determine a rally period can shift within days or even hours. BTC has shown that even at depressed prices, a rally to a higher valuation can take just a few weeks to set up. The activity of USDT shifts quickly. Right now, each USDT coin moves about four times through the exchange ecosystem in a day. During peak activity periods, each coin moves more than 11 times per day, giving the 4.1 billion coins a magnified effect.
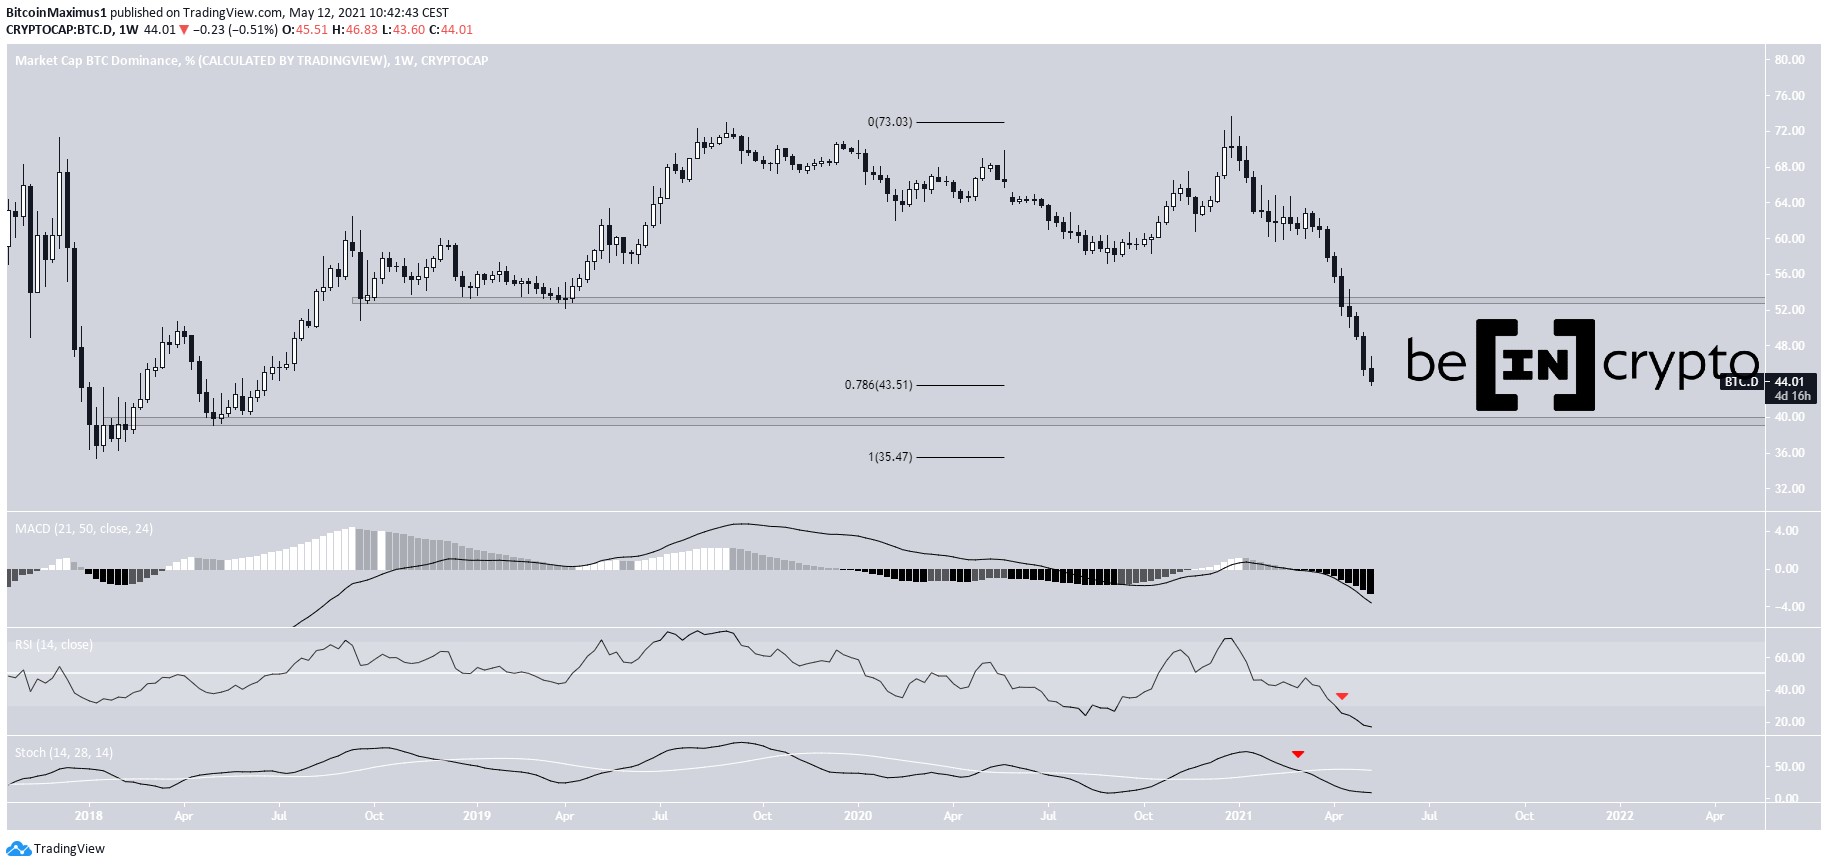
BTC turned down at the end of last week, abandoning the levels above $9,000. On Monday, the coin touched lows very near $8,700, without breaking down under that level. On Tuesday, the price started sinking again, to $8,775.59. The BTC market cap dominance shrank to 66.1%, as BTC erased its positions, while altcoins for now are holding onto relatively stable prices.
What do you think about the BTC market activity? Share your thoughts in the comments section below!
Images via Shutterstock, Twitter @Caprioleio @Ceterispar1bus
The post Bitcoin 90-Day Volume Breaks Bullish Above Peak 2017 Levels appeared first on Bitcoinist.com.
origin »Bitcoin price in Telegram @btc_price_every_hour
Bitcoin (BTC) на Currencies.ru
|
|