2026-4-24 12:24 |
Bitcoin whales are buying the bounce. Hodlers are not. The split between the two cohorts tells a very different story than the one the Bitcoin price rally is showing.
Bitcoin (BTC) trades at $77,670 on April 24, sitting inside a rising channel that has defined the chart since February 24. The rally back above $77,000 looks constructive on the surface. Yet beneath it, two on-chain signals pull in opposite directions. And the divergence reveals what the biggest wallets are actually doing.
Bitcoin Whales Buy Every Bounce, and the April 22 Crossover Was the TriggerThe 10,000 to 100,000 BTC whale cohort has a clear pattern. They buy local bottoms, ride the bounce, and step back. Santiment data shows the cohort jumped its stash from 2.26 million to 2.27 million BTC within four days of Bitcoin’s February 6 low under $62,000. The same cohort added from 2.23 million to 2.26 million BTC between March 23 and early April as price bottomed near $67,700. Now, they are buying again, starting April 22.
Bitcoin Whale Accumulation: SantimentWant more token insights like this? Sign up for Editor Harsh Notariya’s Daily Crypto Newsletter here.
The April 22 buy had a technical trigger. On the 12-hour chart, the 20-period Exponential Moving Average (EMA), a trend line that averages price with more weight on recent candles, crossed above the 200-period EMA. That bullish crossover formed the exact day whales restarted buying. This points to a timing (opportunistic) trade rather than a conviction bet.
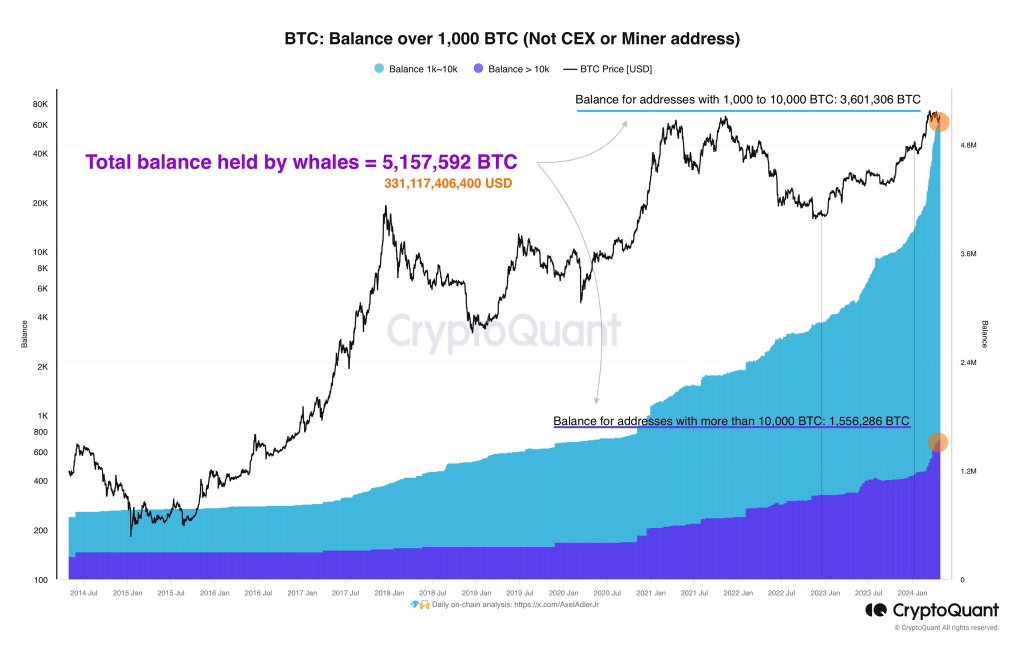
EMA Crossover: TradingViewARK Invest’s Q1 2026 Bitcoin Quarterly adds context. The big money buyers expanded their holdings by 69%, from 2.13 million to 3.60 million BTC during Q1’s 22% drawdown, marking the fastest accumulation pace since the 2020 cycle. However, price has since recovered off those lows.
And the current whale buying is happening at $77,000, not the $68,200 levels where ARK’s conviction data was captured. These are bounce buyers, not bottom buyers.
Hodlers Are Not Joining the Rally, Validating the Bottom Is Not InIf this rally were the start of a durable recovery, mid-term holders would be adding. They are not. Glassnode’s Hodler Net Position Change, a metric that tracks whether mid-term holders are accumulating or distributing BTC, peaked at 38,401 BTC on April 21 at a BTC price of $76,470. By April 24, that reading dropped to roughly 32,303, a 16% collapse in three days. Conviction wallets are not chasing the bounce.
Bitcoin Hodler Net Position Change: GlassnodeThe real conviction wallets are not chasing the bounce. That could be possibly due to the lack of a clear market bottom indicator, one that we highlighted in our previous Bitcoin price analysis.
Bitcoin Price Faces Rejection at $79,528 as the Channel Top Caps the RallyBitcoin pushed to the top of its rising channel at $79,528 on April 22 before reversing. That rejection aligns with the whale pattern. The bounce trade ran into the same upper trendline that has capped every rally since February, and without hodler support, the move has stalled.
A daily close above $79,528 would flip the structure and open the channel’s ceiling near $80,000, with hodler conviction likely to follow. However, rejection here exposes the 0.236 Fibonacci retracement at $75,523 as the first downside test.
Bitcoin Price Analysis: TradingViewA break under $75,523 opens $73,046 and $71,043, and a slide toward the 0.786 Fibonacci level at $66,190 would unlock the channel floor near $62,559. The January rally of 10% can unwind quickly if whales decide the bounce has no legs. For now, $79,528 separates a confirmed breakout from another whale-led bounce that fades back into the channel.
The post Are Bitcoin Whales Opportunists? On-Chain Data Reveals the Truth appeared first on BeInCrypto.
origin »Bitcoin price in Telegram @btc_price_every_hour
Bitcoin (BTC) на Currencies.ru
|
|