2020-6-3 20:36 |
Bears have done it once again, yesterday’s bull break was looking promising after Bitcoin hit $10,300 and $10,500 on some exchanges. Unfortunately, the digital asset kept trading sideways for too many hours indicating that bulls didn’t have that much strength. The trading volume was also quite low which isn’t a good sign after such a critical breakout.
For the past month, the $10,000 level has been an unbreakable barrier for the bulls which have tried several times.
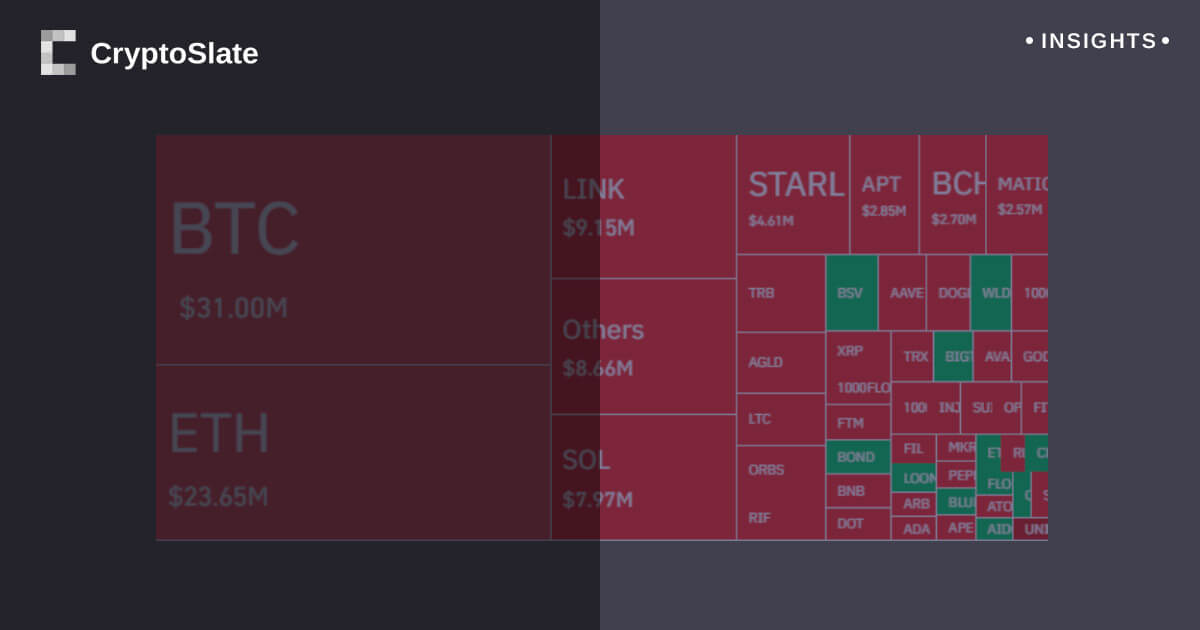
Bitcoin is currently trading at $9,479 at the time of this writing but another leg down could occur at any moment. BitMEX was hit the hardest as Bitcoin fell down to $8,600 on the exchange due to massive liquidations.
Bulls have managed to defend the daily 12-EMA but it’s unclear if they will be able to recover after a 4th rejected attempt at breaking $10K.
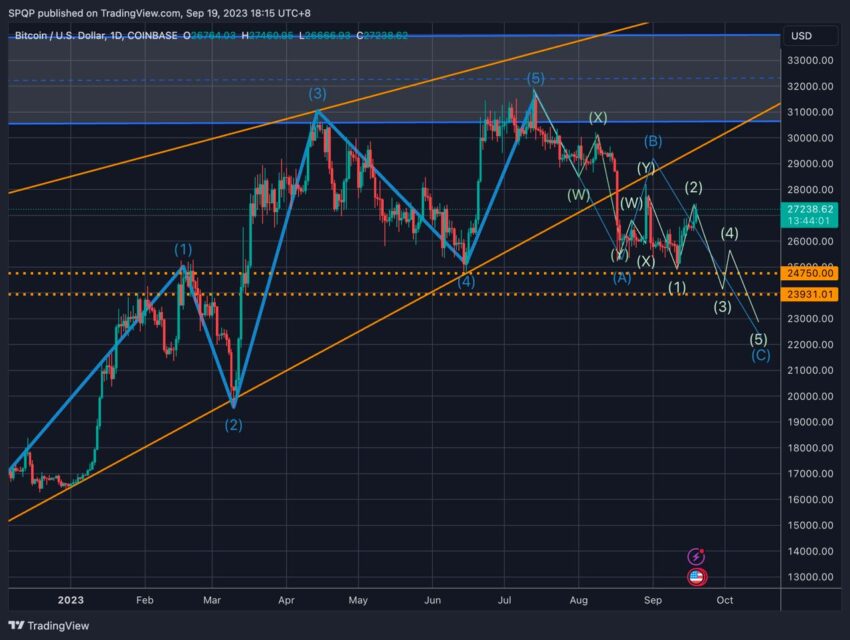
BTC/USDT 4-hour time frameThe 4-hour chart, as well as the hourly, have both formed what’s known as the ‘bart simpson’ pattern. It might sound funny but it is a real pattern in the cryptocurrency market and indicates possible manipulation by whales.
BTCUSDT Chart By TradingViewThis pattern occurs when an asset quickly goes up or down and starts trading sideways followed by an equally violent move to the opposite side.
The 4-hour uptrend has been clearly destroyed and Bitcoin is trading below both EMAs while the MACD has crossed bearishly.
Although the bulls managed to buy a little bit of the dip, this crash puts in question the strength of the bulls and if there is real interest in Bitcoin. At the same time, some analysts think this is still a bullish event for Bitcoin because it can be viewed as an ‘accumulation’ phase and not a simple crash.
The next few hours will be critical for Bitcoin and will decide the direction of the digital asset for the remainder of the week.
origin »Bitcoin price in Telegram @btc_price_every_hour
Bitcoin (BTC) на Currencies.ru
|
|


